by Victor Fagundo
The argument over why Businesses should abandon Excel in favor of more structured tools has been raging for as long as I have had more than a casual exposure to Oracle products. From the standpoint of an IT user Excel appears to be a simplistic, flat-file-based, error-prone tool that careless people use, despite its obvious flaws. Petabytes of duplicative Excel spreadsheets clog network drives across the globe; we as IT users know it, and it drives us crazy. Why, oh why, can’t these analysts, project managers, and accountants not grasp the elegant beauty of a centralized database solution that ensures data integrity, security, and has the chops to handle gobs of data, and abandon their silly Excel sheets?
I’ll tell you why: Excel is better. Excel the most flexible and feature-rich tool for organizing and analyzing data. Ever. Period.
For the past few years I have lived in a hybrid Finance/IT role, and in coming from IT, I was shocked at how much Excel was used, for everything. But after working with Excel on a daily basis for several years, I am a convert. An adept Excel user can out-develop any tool ( BI, Apex, Hyperion, Crystal Reports ) handily. (when dataset size is not an issue). Microsoft has done too much work on Excel, made it too extendable, too intuitive, built in so much, that no structured tool like BI, APEX, SAP, Hyperion will EVER catch up to its usability/flexibility.
Take this real-world example that came across my desk a few months ago: for a retail chain define a by-week, by-unit sales target, and create a report that compares actual sales to this target. Oh, and the weekly sales targets get adjusted each quarter based on current financial outlook.
How quickly could you turn around a DW/BI solution to this problem? What would it involve?
• Create table to house targets
• Create ETL process to load new targets
• Define BMM/Presentation Layers to expose targets
• Develop / test / publish report.
A day? Maybe? If one person handled all steps (unlikely, since the DB layers and RPD layers are probably handled by different people.)
I can tell you how long it took me in Excel: 3 hours (OBIEE driven data-dump, married with target sheet supplied to me). I love OBIEE, but Excel was still miles faster/more efficient for this task. And I could regurgitate 6 other examples like this one off at a moment’s notice.
Case in point: 95% of the data that C-level executives use to make strategic decisions is Excel based.
If you’ve ever sat in on a presentation to a CEO or other C-level executive at any medium to large sized company, you know that people are not bringing up dashboards, or any other applications. They are presenting PowerPoints with a few (less than 7) carefully massaged facts on them. If you trace the source of these numbers back down the rabbit hole, your first stop is always Excel. Within these Excel workbooks you will find “guesses” and “plugs” that fill gaps in solid data, to arrive at an actionable bit of information. It’s these “guesses” and “plugs” that are very hard to code for in an environment like OBIEE (or any other application). Can it be done? Yes, of course, with gobs of time and money. And during the fitful and tense development, the creditably of the application is going to take major hits.
Given the above, the usefulness of OBIEE might seem bleak. But I strongly feel that applications such as OBIEE do have a proper place in the upper organizational layers of modern business: Facilitating the Tactical business layers, and providing data-dumps to the Strategic Business layers.
Since this post is mainly about Excel, I will focus on how OBIEE can support the analyses that are inevitably going to be done in Excel.
Data Formatting, Data Formatting, FORMATTING!! I can’t stress this enough. For an analyst, having to re-format numbers that come out of an export so that you can properly display them or drive calcs off them in Excel is infuriating, and wasteful. My favorite examples: in a BI environment I worked with percentages were exported as TEXT, so while they looked fine in the application, as soon as you exported them to Excel and built calcs off them, your answer was overstated by a factor of 100 (Excel understood “75%” to be the number 75 with a text character appended, not the number 0.75).
Ask your users how they would like to SEE a fact in Excel: with decimals or not? With commas or not? Ensure that when exported to Excel, facts and attributes function correctly.
“Pull” refreshes of information sources in Excel. In the finance world, most Excel workbooks are low to medium complexity financial models, based off a data-dump from a reporting system. When the user wants to refresh the model, they refresh the data-dump, and the Excel calculations do the rest. OBIEE currently forces a user to “push” a new data-dump by manually running/exporting from OBIEE and then pasting the data into the data-dump tab in the workbook. What an Excel user really desires is to have a data dump that can be refreshed automatedly, using values that exist on other parts of the workbook to define filters of data-dump. Then all the user needs to do is trigger a “pull” and everything else is automated. Currently OBIEE has no solution to this problem that is elegant enough for the common Excel user. (Smartview must have its filters defined explicitly in the Smartview UI each time an analysis is pulled.)
The important part to take away from these 2 suggestions, and this entire post, is that to maximize the audience of OBIEE, we must acknowledge that Excel is the preferred tool of the Finance department, due to its flexibility, and support friendly exports to Excel as a best practice. We must also understand that accounting for this flexibility in OBIEE is daunting, and probably not the best use of the tool. If your users are asking for a highly complex attribute or fact, that is fraught with exceptions and estimations, chances are they are going to be much happier if what you give them is reliable information in a data-dump form, and allow them to handle the exceptions and estimations in Excel.
Showing posts with label obiee. Show all posts
Showing posts with label obiee. Show all posts
Monday, October 21, 2013
Tuesday, August 13, 2013
Conditional Formatting of Calculated Items in OBIEE 11g
By Victor Fagundo
As people searched for a work around to this problem 3 common solutions have arisen:
Now with 11g providing conditional formatting that allows you to override the default data format, this is possible via the following steps:
* Note that this would also allow you to apply visual formatting if you wanted to distinguish this row/column as a total.
If you try to setup a filter that is true when the dimension is not in reasonable range of values ( in this example we try to format off all years not in the 2000s ) you will find that your calculated item is skipped as well (this has the added vulnerability of being very explicit):
The reason for all this is that the calculated item “borrows” EACH of the dimension values it operates against. Hence, no matter how inventive your filter is, as long as you are trying to somehow separate the calculated member away from the members it is operating on, you will never succeed. This member “borrowing” is apparent if you add the dimension it operates against to the query a 2nd time, and look at the table view.
But since the “member value” given to the calculated item does not actually exist in the dimension, if you try to perform a count distinct against it, you will always get zero.
There is your difference; there is your “trigger.” The rest is basic formatting.
1: You might suggest that this requirement is better served using column(s) with time series calculations, and you might be right. However, more often than not the user will want to SEE the time periods being compared ( 2012 vs 2011, or 08/07/2012 vs 08/07/2011). When using facts with time series calculations you will only be able to show “this year” vs “last year” since the column heading of the time series calculated fact will always be static. In these cases you will need to use the base fact and a time dimension, along with the solution provided here.
2: All screen shots, and examples used in this post are performed in Sample App V305. An XML of the final correctly formatted report can be downloaded here.
Calculated items in OBIEE Pivot tables can be very useful in certain reporting circumstances, either for ease of development, or to meet specific report requirements. While calculated items in OBIEE are easy, and flexible, they do have one important drawback: they take on the data and display formatting of the fact column they are calculated against.
The most common case is the calculation of a % change across a time dimension in financial reporting ( Year over Year, Quarter over Quarter, etc.). 1 This type of calculation usually takes the form of a percent change calculation similar to below:
(( $2 - $1 ) / $1) *100
By default, if you perform this calculation against a numerical fact ( sales, customers) you will run into the problem of how to display the % change in the correct format, since the calculated % will want to take the form of the fact it is calculated against, as can be seen in the example 2 below:
 |
| Figure 1 - Pivot Table |
 |
| Figure 2 - Calculated item |
 |
Figure 3 - Results
|
Not very pretty at all.
- Use HTML formatting tricks to “hide” trigger text in the results, then conditionally format off those triggers. While inventive, as the comments note, this solution falls flat if the report is ever printed, as the PDF engine will pick up and display all of the hidden characters.
- Convert the pivot table to a regular table with some complex column formulas. Very time consuming and cumbersome, would also not solve the requirement of showing the dimension values noted as noted in Footnote1.
- Convert the calculated result to text and manually add your formatting characters. I don’t think this actually works since the calculated fields won’t accept logical SQL functions, and this would be very cumbersome.
- Add a column that is a COUNT DISTINCT on the dimension that you are calculating across ( in the displayed example, “Time T05 Per Name Year”. This column will serve as your “trigger” to apply your conditional formatting.
 Figure 4 - Column Formula
- For each of your facts, apply a conditional format that is triggered when the above column value is zero. In the formatting, apply whatever visual and data formats you desire. In this example we will format the data as a percent, with one decimal place.
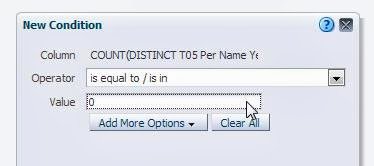
Figure 5 - Condition

Figure 6 - Format when condition is met
- Exclude the “trigger” column from your pivot view. View your results and be satisfied:

Figure 7 - Correct formatting of calculated item.
* Note that this would also allow you to apply visual formatting if you wanted to distinguish this row/column as a total.
Why it works
The use of conditional formatting that applies a data type as part of the format is a straightforward leap of logic, but what to use as the trigger? Most people will try to use the dimension they have setup the calculation in. However, if you try to use the text description given to the calculated item you will find that the condition is never applied: |
| Figure 8 - Condition on dimension |
 |
| Figure 9 - Condition never met, format never applied |
If you try to setup a filter that is true when the dimension is not in reasonable range of values ( in this example we try to format off all years not in the 2000s ) you will find that your calculated item is skipped as well (this has the added vulnerability of being very explicit):
 |
| Figure 10 - Condition on dimension values |
 |
| Figure 11- Condition never met, format never applied |
The reason for all this is that the calculated item “borrows” EACH of the dimension values it operates against. Hence, no matter how inventive your filter is, as long as you are trying to somehow separate the calculated member away from the members it is operating on, you will never succeed. This member “borrowing” is apparent if you add the dimension it operates against to the query a 2nd time, and look at the table view.
 |
| Figure 12 - Calculated item "borrows" members |
But since the “member value” given to the calculated item does not actually exist in the dimension, if you try to perform a count distinct against it, you will always get zero.
 |
| Figure 13 - Count distinct against dimension |
There is your difference; there is your “trigger.” The rest is basic formatting.
1: You might suggest that this requirement is better served using column(s) with time series calculations, and you might be right. However, more often than not the user will want to SEE the time periods being compared ( 2012 vs 2011, or 08/07/2012 vs 08/07/2011). When using facts with time series calculations you will only be able to show “this year” vs “last year” since the column heading of the time series calculated fact will always be static. In these cases you will need to use the base fact and a time dimension, along with the solution provided here.
2: All screen shots, and examples used in this post are performed in Sample App V305. An XML of the final correctly formatted report can be downloaded here.
Sunday, February 10, 2013
Fun with Date Math
(First off, sorry Mike, I'm hoping this will break my writer's block...)
On Friday I was asked to look at a report that wasn't returning all of the data. Sample:
Notice anything funny there?
Yeah, February is missing. The (OBIEE) report has a filter on Jan, Feb and Mar of 2013. But it wasn't showing up. I confirmed via manual SQL (hah!) that there was (YAGO) data in there for February. Any ideas?
I immediately suspected one of two things:
- If the Date (month) dimension had a "year ago" column it was wrong.
- The join in OBIEE was doing it wrong.
I checked the date dimension first. It was fine. It didn't even have a YAGO column, so nothing to see there. I looked at the join between the date dimension and the fact table...
OK, so the MONTH_DIM_KEY is in the YYYYMMDD format. MONTHEND_DATE is a date data-type that corresponds to the last day of the month. For February 2013, it's 20130228, For February 2012, it should be 20120229. <<< Leap Year!!! I'm going to make a wild guess and say that the formula up there isn't working. How to test it though? That's logical SQL (OBIEE), it doesn't run in the database. I just ran the report and grabbed the SQL submitted to the database. This is what it looked like:
One part of that wouldn't be so bad, but it's three formulas adding up to some mysterious number (presumably the last day of the month, for the previous year, in YYYYMMDD format). So I moved all those formulas up into the SELECT part of the statement. Let's see what they are doing.
One of my favorites, especially when dealing with leap years, is ADD_MONTHS.
That's why. Add -12 months to February 28, 2013. You don't get back February 28, 2012, you get back the 29th, as it should be. Do the same thing starting with February 29th, 2012. Add 12 months, subtract 12 months. It's always right. Yay for someone figuring this out so I don't ever have to do so.
Sadly, OBIEE doesn't have the equivalent of ADD_MONTHS (or LAST_DAY), you have to build out a string and then concatenate it all together, not pleasant. So I cheated, I used EVALUATE. Here's my working solution.
On Friday I was asked to look at a report that wasn't returning all of the data. Sample:
Year/Month  Total Sales Total Sales (YAGO)
------------------------------------------
01/31/2013   $1,000,000           $900,000
03/31/2013                        $950,000
For reference, YAGO is "Year Ago."
Notice anything funny there?
Yeah, February is missing. The (OBIEE) report has a filter on Jan, Feb and Mar of 2013. But it wasn't showing up. I confirmed via manual SQL (hah!) that there was (YAGO) data in there for February. Any ideas?
I immediately suspected one of two things:
- If the Date (month) dimension had a "year ago" column it was wrong.
- The join in OBIEE was doing it wrong.
I checked the date dimension first. It was fine. It didn't even have a YAGO column, so nothing to see there. I looked at the join between the date dimension and the fact table...
(YEAR ("DW".""."DW"."My_Month_Dim"."MONTHEND_DATE" ) - 1 ) * 10000
+  MONTH ("DW".""."DW"."My_Month_Dim"."MONTHEND_DATE" )  * 100
+ CASE WHEN DayOfMonth("DW".""."DW"."My_Month_Dim"."MONTHEND_DATE") = 29 THEN 28 ELSE
DayOfMonth("DW".""."DW"."My_Month_Dim"."MONTHEND_DATE")  END
= "DW".""."DW"."My_Fact_Table"."MONTH_DIM_KEY"
I want to tear my eyes out when I see stuff like that. I don't even want to know what it does. * 1000? * 100? Shoot me.
OK, so the MONTH_DIM_KEY is in the YYYYMMDD format. MONTHEND_DATE is a date data-type that corresponds to the last day of the month. For February 2013, it's 20130228, For February 2012, it should be 20120229. <<< Leap Year!!! I'm going to make a wild guess and say that the formula up there isn't working. How to test it though? That's logical SQL (OBIEE), it doesn't run in the database. I just ran the report and grabbed the SQL submitted to the database. This is what it looked like:
          AND ( TO_NUMBER( TO_CHAR( MONTHEND_DATE, 'yyyy' ), '9999' ) - 1 ) * 10000 +
          TO_NUMBER( TO_CHAR( MONTHEND_DATE, 'MM' ), '99' ) * 100 +
          CASE
            WHEN TO_NUMBER( TO_CHAR( MONTHEND_DATE, 'dd' ), '99' ) = 29
            THEN 28
            ELSE TO_NUMBER( TO_CHAR( MONTHEND_DATE, 'dd' ), '99' )
          END = MONTH_DIM_KEY
  AND( MONTHEND_DATE IN( TO_DATE( '2013-01-31', 'YYYY-MM-DD' ), TO_DATE(
  '2013-02-28', 'YYYY-MM-DD' ), TO_DATE( '2013-03-31', 'YYYY-MM-DD' ) ) )
Eyes are burning again. This is also the "prettified" SQL after I hit Ctrl + F7 in SQL Developer. The very first thing I do with OBIEE generated SQL.
One part of that wouldn't be so bad, but it's three formulas adding up to some mysterious number (presumably the last day of the month, for the previous year, in YYYYMMDD format). So I moved all those formulas up into the SELECT part of the statement. Let's see what they are doing.
SELECT
  ( TO_NUMBER( TO_CHAR( MONTHEND_DATE, 'yyyy' ), '9999' ) - 1 ) * 10000 part_1,
  TO_NUMBER( TO_CHAR( MONTHEND_DATE, 'MM' ), '99' ) * 100 part_2,
  CASE
    WHEN TO_NUMBER( TO_CHAR( MONTHEND_DATE, 'dd' ), '99' ) = 29
    THEN 28
    ELSE TO_NUMBER( TO_CHAR( MONTHEND_DATE, 'dd' ), '99' )
  END part_3
FROM my_month_dim
WHERE MONTHEND_DATE IN ( TO_DATE( '2013-01-31', 'YYYY-MM-DD' ),
                         TO_DATE( '2013-02-28', 'YYYY-MM-DD' ),
                         TO_DATE( '2013-03-31', 'YYYY-MM-DD' ) )
That resulted in this:PART_1 PART_2 PART_3 20120000 100 31 20120000 200 28 20120000 300 31So PART_3 is definitely incorrect. Am I going to bother to figure out why? I have some serious issues inside of my brain which simply do not allow me to do date math. I avoid it at all costs...instead choosing to use whatever the system provides me.
One of my favorites, especially when dealing with leap years, is ADD_MONTHS.
If date is the last day of the month or if the resulting month has fewer days than the day component of date, then the result is the last day of the resulting month
That's why. Add -12 months to February 28, 2013. You don't get back February 28, 2012, you get back the 29th, as it should be. Do the same thing starting with February 29th, 2012. Add 12 months, subtract 12 months. It's always right. Yay for someone figuring this out so I don't ever have to do so.
Sadly, OBIEE doesn't have the equivalent of ADD_MONTHS (or LAST_DAY), you have to build out a string and then concatenate it all together, not pleasant. So I cheated, I used EVALUATE. Here's my working solution.
TO_NUMBER( TO_CHAR( ADD_MONTHS( MONTHEND_DATE, -12 ), 'YYYYMMDD' ) ) = DW_MONTH_DIM_KEYOops, that's the physical SQL. How about the OBIEE SQL:
CAST( EVALUATE( 'TO_NUMBER( TO_CHAR( ADD_MONTHS( %1, %2 ), %3 ) )',
 "EDW".""."DW"."Dim_DW_MONTH_DIM_CBM"."MONTHEND_DATE",
-12, 'YYYYMMDD' ) AS INTEGER ) = "DW".""."DW"."My_Fact_Table"."MONTH_DIM_KEY"
Friday, November 9, 2012
VirtualBox 4.2.4
 I was working on my OBIEE Test Lab today. Having network issues, because I'm prone to those. I decided to look up The Fat Bloke as he seems to be the resident expert on all things VirtualBox. As to my network issues, The Fat Bloke had this great post back in June, which helped me understand how VirtualBox network interfaces work.
So, as I said, I was looking for some new articles. I ran across this one, What's New in Oracle VM VirtualBox 4.2?. There was this section on Groups. I tried it out on mine...it didn't work. I check my version, 4.1.something. Hmmm. The article was dated September. I should have this. No sooner did I think that, I got an update message from VirtualBox saying a new release was available. Sweet!
So now I'm running the latest:

So what is this group stuff? You can go read the article, but I'll quote the important stuff here:
Groups allow you to organize your VM library in a sensible way, e.g. by platform type, by project, by version, by whatever. To create groups you can drag one VM onto another or select one or more VM's and choose Machine...Group from the menu bar. You can expand and collapse groups to save screen real estate, and you can Enter and Leave a group (think iPad navigation here) by using the right and left arrow keys when groups are selected.
But groups are more than passive folders, because you can now also perform operations on groups, rather than all the individual VMs. So if you have a multi-tiered solution you can start the whole stack up with just one click.
But groups are more than passive folders, because you can now also perform operations on groups, rather than all the individual VMs. So if you have a multi-tiered solution you can start the whole stack up with just one click.
Very cool stuff. Now I can logically group my OBIEE Test Lab VMs. If I ever get around to having the software (database, OBIEE) start automatically, I'll be rocking.

Lots of cool new stuff there. Read the article and go get the software.
Thursday, November 8, 2012
BIWA Summit 2013
 I meant to write about this sooner...
If you're looking for a good BI/DW/Analytics focused event, check out the BIWA Summit which takes place in January of 2013. If you're interested in speaking at the event (and you know you are), hurry up and get your abstract in here, it closes tomorrow (November 9th).
Day 1 will give us Tom Kyte who will talk about What's new from Oracle in BI and Data warehousing. Day 2 will feature Vaishnavi Sashikanth, Vice President, Development, Oracle Advanced Analytics at Oracle who will speak on Making Big Data Analytics Accessible.
For more information, go here and here.
Thursday, October 25, 2012
OBIEE: 14006 Unsupported Predicate
My favorite Admin tool error:

In one of our subject areas, we recently changed the physical source from one system to another. No big deal right?
One of my colleagues figured out this neat little trick using Fragmentation content on the Content table of a logical table source. Basically, if the date was yesterday or greater, use Table_A, if not, use Table_B. Worked like a charm.
With the change to the physical source, it no longer worked. WTH?
I suspected the Fragmentation content because the data types changed, well, one was no longer the driver, if that makes sense. See, we had to do this work-around because the original source system wasn't designed with date date types. We had to pass a string in the YYYY-MM-DD format.
With the new source, that was resolved. We now had a date data type, awesome.
Not so awesome, because it broke. By broke I mean all the facts were doubling for everything but the current day (today).
If you're wondering, here is the logic in the Fragmentation content section for Table_A:
Since we now had a true date data type, I tried to use that, which is how I came across the 14006 Unsupported Predicate issue. You see, now I didn't have to use a repository variable, I could simply use OBIEE date functions. I came up with this to mimic the same behavior:

It's a valid formula. Works in Answers (or whatever it's called these days). Perhaps someone with far more experience can spot the mistake.

In one of our subject areas, we recently changed the physical source from one system to another. No big deal right?
One of my colleagues figured out this neat little trick using Fragmentation content on the Content table of a logical table source. Basically, if the date was yesterday or greater, use Table_A, if not, use Table_B. Worked like a charm.
With the change to the physical source, it no longer worked. WTH?
I suspected the Fragmentation content because the data types changed, well, one was no longer the driver, if that makes sense. See, we had to do this work-around because the original source system wasn't designed with date date types. We had to pass a string in the YYYY-MM-DD format.
With the new source, that was resolved. We now had a date data type, awesome.
Not so awesome, because it broke. By broke I mean all the facts were doubling for everything but the current day (today).
If you're wondering, here is the logic in the Fragmentation content section for Table_A:
"BMM"."Dim - Date"."YYYY-MM-DD Column" >= VALUEOF( "INIT_BLOCK"."YYYY-MM-DD" )For Table B:
"BMM"."Dim - Date"."YYYY-MM-DD Column" < VALUEOF( "INIT_BLOCK"."YYYY-MM-DD" )The only thing different is the operator.
Since we now had a true date data type, I tried to use that, which is how I came across the 14006 Unsupported Predicate issue. You see, now I didn't have to use a repository variable, I could simply use OBIEE date functions. I came up with this to mimic the same behavior:
"BMM"."Dim - Date"."Date (Data Type!)" < CAST( TIMESTAMPADD( SQL_TSI_DAY, -1, CURRENT_TIMESTAMP ) AS DATE )Of course I changed the operator for each LTS. Save RPD, Transaction Update Failed. Check Consistency,

It's a valid formula. Works in Answers (or whatever it's called these days). Perhaps someone with far more experience can spot the mistake.
Wednesday, October 17, 2012
OBIEE: Where'd my SQL Go? Part II
Back in July I wondered where my SQL went when I deployed an opaque view to the database. I found it.
Recently, I was introduced to a person at the client site I'll just call The Process Queen™. I had written some code (pipelined table function) that was to be deployed to the database, she wasmaking helping me get it into SVN and showing me how they deployed code. The Process Queen™
In that regard, I wanted to get everything that we could into SVN. Those opaque views (now deployed as database views) were a perfect candidate.
The client impressed me with their deployment tools, I hadn't seen anything like it. I wish I could say more, of course...perhaps I can talk The Process Queen into a guest post?
Anyway, so there I was, following my own guide Where'd My SQL Go? and then I noticed this

and this.

Notice those SQL statements are different. Apparently in OBIEE you can add a SQL statement in to each and every database type that you want.
An interesting, if not scary, find. Which begs the question, why would you need this kind of functionality?
Recently, I was introduced to a person at the client site I'll just call The Process Queen™. I had written some code (pipelined table function) that was to be deployed to the database, she was
In that regard, I wanted to get everything that we could into SVN. Those opaque views (now deployed as database views) were a perfect candidate.
The client impressed me with their deployment tools, I hadn't seen anything like it. I wish I could say more, of course...perhaps I can talk The Process Queen into a guest post?
Anyway, so there I was, following my own guide Where'd My SQL Go? and then I noticed this

and this.

Notice those SQL statements are different. Apparently in OBIEE you can add a SQL statement in to each and every database type that you want.
An interesting, if not scary, find. Which begs the question, why would you need this kind of functionality?
Tuesday, August 28, 2012
Custom ORACLENERD T-Shirts
Jeff Smith has said for some time now that I need to market the t-shirts better than I do. Selling them has never been a priority. Yes, it's pretty cool seeing the t-shirts out and about. It's cool that people can express their inner oraclenerd like I seem to do on a daily basis. The real reason I put effort into t-shirts and the like, is katezilla.
Recently we got hit with a couple of things: 1, a $190 iPad app for Kate and 2, her ABA therapy co-pays finally came due. For #1, I ran a GoFundMe campaign and encouraged you to buy t-shirts. The GoFundMe campaign raised $420 in less than a day, more than covering the cost of Kate's iPad app. I used the remaining funds to make a payment on #2, her ABA co-pays. I also sold about 10 shirts just after that post and close to 20 in total since.
I am constantly humbled at your generosity.
What does all of this have to do with the title? Well, people have asked for shirts either through Twitter, IM or email. Shirts with specific sayings or different styles. Two weekends ago on a Friday night, Don Seiler suggested a hoodie. Living in Florida I had never thought about it, but he lives in Wisconsin where it gets a little cold. We went back and forth on twitter, I would go on Spreadshirt and spin something up, screenshot it, and send it across the wire. On Monday I had a final product and I named it after Mr. Seiler.
Mr. Seiler (picture) ordered one and so did Mr. Smith. Awesome.
The other shirt there is the German Austrian edition. Martin Berger was responsible for that one (I have a Cyrillic and Russian version in the hopper for Greg Rahn).
Late last week I talked to Lisa Dobson. She got one last year for OpenWorld and wanted a new one, with a twist.
Upside down logo (she's British). So I named it after her. Note, the pink version is only available in the US, that brand isn't carried on the European Spreadshirt site.
So, if you have an idea (Mr. Seiler has designed two now, the long sleeve baseball jersey and the hoodie), send it to me and I'll spin something up for you.
How could I forget the APEX version (Joel Kallman)? Or the OBIEE version (Adrian Ward)?
Because I'm forgetful. I'm sure there are others.
Just so it's clear, there are two shops: North America and Europe. They're not exactly the same as it's two separate systems, but I'm trying to keep them in sync.
Send me your suggestions...all proceeds go to a great cause katezilla.
Recently we got hit with a couple of things: 1, a $190 iPad app for Kate and 2, her ABA therapy co-pays finally came due. For #1, I ran a GoFundMe campaign and encouraged you to buy t-shirts. The GoFundMe campaign raised $420 in less than a day, more than covering the cost of Kate's iPad app. I used the remaining funds to make a payment on #2, her ABA co-pays. I also sold about 10 shirts just after that post and close to 20 in total since.
I am constantly humbled at your generosity.
What does all of this have to do with the title? Well, people have asked for shirts either through Twitter, IM or email. Shirts with specific sayings or different styles. Two weekends ago on a Friday night, Don Seiler suggested a hoodie. Living in Florida I had never thought about it, but he lives in Wisconsin where it gets a little cold. We went back and forth on twitter, I would go on Spreadshirt and spin something up, screenshot it, and send it across the wire. On Monday I had a final product and I named it after Mr. Seiler.
Mr. Seiler (picture) ordered one and so did Mr. Smith. Awesome.
| The Don Seiler Hoodie | The |
 |
 |
Late last week I talked to Lisa Dobson. She got one last year for OpenWorld and wanted a new one, with a twist.
| The Lisa Dobson | The Lisa Dobson Pink |
 |
 |
Upside down logo (she's British). So I named it after her. Note, the pink version is only available in the US, that brand isn't carried on the European Spreadshirt site.
So, if you have an idea (Mr. Seiler has designed two now, the long sleeve baseball jersey and the hoodie), send it to me and I'll spin something up for you.
How could I forget the APEX version (Joel Kallman)? Or the OBIEE version (Adrian Ward)?
Because I'm forgetful. I'm sure there are others.
Just so it's clear, there are two shops: North America and Europe. They're not exactly the same as it's two separate systems, but I'm trying to keep them in sync.
Send me your suggestions...all proceeds go to a great cause katezilla.
Wednesday, August 1, 2012
Building an OBIEE Test Lab - Part II
So it's taking a little longer than I anticipated. That's a good thing (for me anyway). In Part I, I tried to diagram out what my plans were. My drawing was crude, and remains so. Mike Durran left me a link to the drawing below which is found here in the docs.

Now I'm an ambitious lad, but not that ambitious. This is for fun and amusement, perhaps I'll learn a thing or two along the way.
So how does this qualify as Part II? Well, I finally created the database. (No, I'm not going RAC like the diagram and docs say. Like I said, I'm not completely nutters.) This is an accomplishment for me as it's been quite some time since I've built anything, close to a year. So I'm celebrating by writing.
This database will serve as the repository home for OBIEE and perhaps something like Identity Manager (OVM, OAM). I'll probably end up using it as a source and target for various projects as well.

Now I'm an ambitious lad, but not that ambitious. This is for fun and amusement, perhaps I'll learn a thing or two along the way.
So how does this qualify as Part II? Well, I finally created the database. (No, I'm not going RAC like the diagram and docs say. Like I said, I'm not completely nutters.) This is an accomplishment for me as it's been quite some time since I've built anything, close to a year. So I'm celebrating by writing.
Oracle Enterprise Linux 64 bit, 5.8
2.6.32-300.32.1.el5uek
Database: 11.2.0.1
Database host: oracle-db
Database SID: TESTING
I used OEL 5.8 because that's the latest version I could find that was certified for 11.2.0.1 (straight from OTN). I was unable to find a single document that listed out the supported OSes, but I'm not that adept at searching through MOS yet (LOWER( DBA )). If you know where it is, please link it up.
This database will serve as the repository home for OBIEE and perhaps something like Identity Manager (OVM, OAM). I'll probably end up using it as a source and target for various projects as well.
Thursday, July 12, 2012
Fun with OBIEE SQL
I posted a couple of tweets yesterday about this crazy query I had to work with. I won't Storify you to death, so I'll sum it up quickly. 1269 lines (formatted, of course). 13 WITH clauses. 8 base tables.
The error that was occurring was an Oracle one: ORA-00937, "not a single-group function."
That's interesting because OBIEE, the BI Server, generates/builds the SQL based on the logical model you've created. It's doing it wrong, in this instance. I'm willing to wager that it's a bug, in one way or another.
Now, if the logical model doesn't support this particular combination of columns, grain, or whatever, it will tell me so immediately. It will usually tell me while working in the RPD, so I won't even get this far (presentation layer).
Anyway, I found the offending piece of SQL, right at the bottom in the SELECT statement. There were 2 analytic functions, MIN and SUM and no GROUP BY. So I took the non-analytic columns, created a GROUP BY and added them in. It worked.
That didn't solve my problem though. Sure, I could run it in SQL Developer, but that doesn't do the end-user much good.
I tried to trace those 2 columns back up through the SQL...and then my eyes bled. With help from the user, I identified the column (measure) that was breaking the report. Now, could I trace this back through the SQL and figure out where? Not likely, but I tried.
I needed a visual representation, so I tried out FreeMind, a mind mapping software. This is what I came up with:

Nodes in Yellow share the same base tables. Ditto for the other color coded nodes. I couldn't figure out a way to get them to connect or share those child nodes.
Ultimately a fun little exercise (in futility?). Anyone else tried to do something like this?
The error that was occurring was an Oracle one: ORA-00937, "not a single-group function."
That's interesting because OBIEE, the BI Server, generates/builds the SQL based on the logical model you've created. It's doing it wrong, in this instance. I'm willing to wager that it's a bug, in one way or another.
Now, if the logical model doesn't support this particular combination of columns, grain, or whatever, it will tell me so immediately. It will usually tell me while working in the RPD, so I won't even get this far (presentation layer).
Anyway, I found the offending piece of SQL, right at the bottom in the SELECT statement. There were 2 analytic functions, MIN and SUM and no GROUP BY. So I took the non-analytic columns, created a GROUP BY and added them in. It worked.
That didn't solve my problem though. Sure, I could run it in SQL Developer, but that doesn't do the end-user much good.
I tried to trace those 2 columns back up through the SQL...and then my eyes bled. With help from the user, I identified the column (measure) that was breaking the report. Now, could I trace this back through the SQL and figure out where? Not likely, but I tried.
I needed a visual representation, so I tried out FreeMind, a mind mapping software. This is what I came up with:

Nodes in Yellow share the same base tables. Ditto for the other color coded nodes. I couldn't figure out a way to get them to connect or share those child nodes.
Ultimately a fun little exercise (in futility?). Anyone else tried to do something like this?
Tuesday, July 3, 2012
OBIEE: Where'd my SQL go?
With the introduction of 11g, you can now deploy your opaque views to the database as, well, database views. It will simply wrap up your SQL statement inside a CREATE OR REPLACE VIEW... and run that statement using the connection pool you specified. Of course this means your connection pool has to have privileges to create objects, which may not be the case if you are using "read only" connections.
Anyway, if your development environment is refreshed from production on a regular basis, objects and all, you'll need to redeploy those views. Naturally, you saved that ad-hoc like SQL in subversion or some other source control tool...oops, you didn't?
All is not lost.
First, it's relatively easy, if you have a magnifying glass, to pick out the deployed views, they look like this:
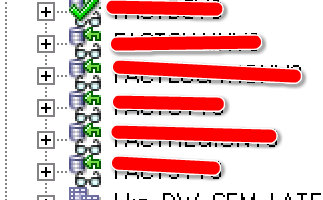
Now, just go into the table properties, General tab and go to the dropdown box:
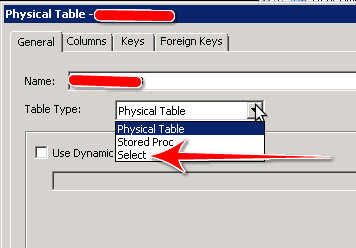
Select the Select selection (hah!). If you're a bit uptight about putting it in the correct location (like I am), you may have to navigate to the appropriate database version. For me, Oracle 10g R2:
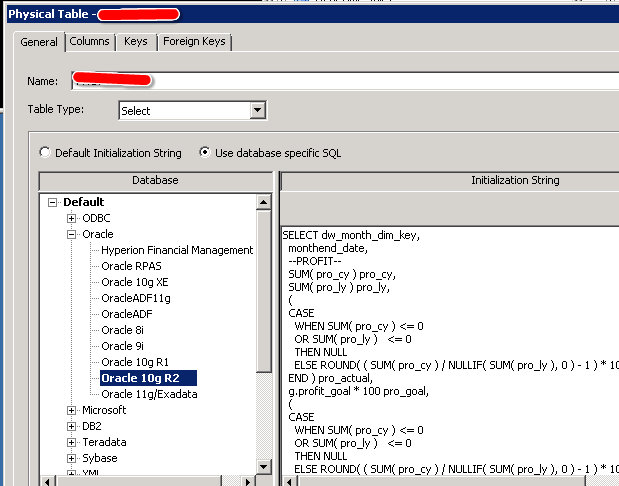
Voilà!
Another option that you could use would be to Copy (Ctrl+C) the object in question and then paste (Ctrl+V) into notepad or some similar tool. Should be fairly easy to spot the SQL.
Anyway, if your development environment is refreshed from production on a regular basis, objects and all, you'll need to redeploy those views. Naturally, you saved that ad-hoc like SQL in subversion or some other source control tool...oops, you didn't?
All is not lost.
First, it's relatively easy, if you have a magnifying glass, to pick out the deployed views, they look like this:

Now, just go into the table properties, General tab and go to the dropdown box:

Select the Select selection (hah!). If you're a bit uptight about putting it in the correct location (like I am), you may have to navigate to the appropriate database version. For me, Oracle 10g R2:

Voilà!
Another option that you could use would be to Copy (Ctrl+C) the object in question and then paste (Ctrl+V) into notepad or some similar tool. Should be fairly easy to spot the SQL.
Thursday, June 14, 2012
TRUNC Time Off Date in OBIEE
"How do I get a prompt to display the day, minus 3 hours?" was the question.
This was a dashboard prompt (calendar widget) with a default value that used the following SQL:
We just needed to add a predicate or WHERE clause. What would I compare it with?
OK, I have a date column (with the no time component), so I can use that. I also have to use OBIEE (Logical) SQL. Gah. I wrote it in Oracle SQL first, day_column = sysdate - ( 3 / 24 ). Wait, I have to TRUNC the date to compare it to a date or else I won't get anything back. day_column = TRUNC( sysdate - ( 3 / 24 ) ). Better. I test it out and it does what I need it to do.
Now, to convert it to OBIEE SQL.
Instead of SYSDATE, I'll use CURRENT_DATE. Now I need to subtract 3 hours. TIMESTAMPADD for that.
This was a dashboard prompt (calendar widget) with a default value that used the following SQL:
SELECT CURRENT_DATE
FROM "Subject Area"
OK, easy enough.
We just needed to add a predicate or WHERE clause. What would I compare it with?
OK, I have a date column (with the no time component), so I can use that. I also have to use OBIEE (Logical) SQL. Gah. I wrote it in Oracle SQL first, day_column = sysdate - ( 3 / 24 ). Wait, I have to TRUNC the date to compare it to a date or else I won't get anything back. day_column = TRUNC( sysdate - ( 3 / 24 ) ). Better. I test it out and it does what I need it to do.
Now, to convert it to OBIEE SQL.
Instead of SYSDATE, I'll use CURRENT_DATE. Now I need to subtract 3 hours. TIMESTAMPADD for that.
[nQSError: 22025] Function TimestampAdd is called with an incompatible type. (HY000)Oops. How about CURRENT_TIMESTAMP? Yeah, that works. Here's what I have so far:
TIMESTAMPADD( SQL_TSI_HOUR, -3, CURRENT_TIMESTAMP )That doesn't work either. Ah, the time component, need to get rid of that. TRUNCATE? Nope, it's for numbers. Hmmm...wait, CAST! I'll just cast it to a date which should remove the time component.
CAST( TIMESTAMPADD( SQL_TSI_HOUR, -13, CURRENT_TIMESTAMP ) AS DATE )Awesome. The final logical SQL looks like this:
SELECT CURRENT_DATE
FROM "Subject Area"
WHERE
( ( "Date"."Date" IN ( CAST( TIMESTAMPADD( SQL_TSI_HOUR, -13, CURRENT_TIMESTAMP ) AS DATE ) ) ) )
Easy.
Thursday, May 31, 2012
Building an OBIEE Test Lab
About 1.5 years ago I bought myself a nice little desktop. The only issues I've had with this computer over that time are the OS upgrades (Ubuntu). It has been an outstanding machine. I currently have 3 "computers" running, 2 Windows VMs and the host machine. I've had upwards of 5 running at once. That's with only 24 GB of RAM. I plan on upgrading to 48 in the near future (max of 96).
One of the motivators for buying the machine was the recent (at the time) release of OBIEE 11g, which required significantly more power. I've installed OBIEE 11g a number of times in virtual machines, but usually just put everything on a single machine (Oracle Enterprise Linux).
Now, I'd like to build out a machine for each component. Why? I have no earthly idea. Fun perhaps?
So here's my starting point:

There are no lines or anything yet, I'm just trying to get it down on paper before I start.
There are 4 distinct sets of software there:
Also, you could split that up into 5 software components. You can install WebLogic by itself and then install (software only) OBIEE on top of that. Doubt I'll go that route for this first go, but we'll see. None of this includes source systems either. Somewhere around here I have a fresh install of EBS. Then I would have to install Informatica and the DAC. I'm sure I could get this up to 10 machines. I must watch out for scope creep. Bah, who am I kidding?
As I update my Visio doc I'll update the blog as well and share the progress with you.
I'll start by creating a snapshot of Oracle Enterprise Linux (5.7 I believe is the latest compatible release with OBIEE) and then use that as the base for everything else (database, web tier, etc). If I'm missing something or you think I should add something, leave a comment.
One of the motivators for buying the machine was the recent (at the time) release of OBIEE 11g, which required significantly more power. I've installed OBIEE 11g a number of times in virtual machines, but usually just put everything on a single machine (Oracle Enterprise Linux).
Now, I'd like to build out a machine for each component. Why? I have no earthly idea. Fun perhaps?
So here's my starting point:

There are no lines or anything yet, I'm just trying to get it down on paper before I start.
There are 4 distinct sets of software there:
- Oracle Database 11.2.0.2 - This will serve as the repository for OBIEE and most likely OVD/OAM (I don't know that software well enough yet).
- OBIEE 11.1.1.6
- Oracle Identity Management
- Oracle Web Tier - This is the Oracle HTTP Server and Oracle WebCache. You can find it on e-delivery
Also, you could split that up into 5 software components. You can install WebLogic by itself and then install (software only) OBIEE on top of that. Doubt I'll go that route for this first go, but we'll see. None of this includes source systems either. Somewhere around here I have a fresh install of EBS. Then I would have to install Informatica and the DAC. I'm sure I could get this up to 10 machines. I must watch out for scope creep. Bah, who am I kidding?
As I update my Visio doc I'll update the blog as well and share the progress with you.
I'll start by creating a snapshot of Oracle Enterprise Linux (5.7 I believe is the latest compatible release with OBIEE) and then use that as the base for everything else (database, web tier, etc). If I'm missing something or you think I should add something, leave a comment.
Monday, January 23, 2012
OBIEE 11g: Where's the Compare Repositories Dialog?
Recently I decided to try out the new patching capabilities for the metadata in OBIEE 11g. The big reason for me was to avoid having to reset my connection pools. Each time I did a 3 way merge, the connection pools would get over-written with their development credentials. When I was doing the merge, I could never find a way to isolate (leave out) those objects, so it was off to try the patching.
What this patching does is creates an xml file of the differences between 2 RPDs. You can then edit that XML file if you so desire. Most of my duties over the last couple of years have centered around the RPD and front-end stuff, not nearly as much on the administrative side (i.e. migrations). So I need to catch up with the rest of the world.
Reading through the docs, I'm told that I need to use the "Compare repositories" dialog. OK, easy enough.

Where is my entry for it?
OK, let's try the Compare entry.

Since I'm using the prod_20120122 RPD, I select the dev_20120122 RPD.
I'm prompted for the Repository Password and then it spins for a few seconds, then gives me this

I select Yes.

OK...where's the Compare Repositories Dialog like the docs say?
I see the icons have changed signifying differences, but no dialog as mentioned in the docs.
What if I select No?

Ah, there it is.
Interestingly, if I maximize that Compare Repositories Dialog, the next time I run the Compare, I can see it plain as day.

Hopefully you'll find this next time you endeavor to learn how to patch your RPD and can't seem to find the Compare Repositories Dialog.
What this patching does is creates an xml file of the differences between 2 RPDs. You can then edit that XML file if you so desire. Most of my duties over the last couple of years have centered around the RPD and front-end stuff, not nearly as much on the administrative side (i.e. migrations). So I need to catch up with the rest of the world.
Reading through the docs, I'm told that I need to use the "Compare repositories" dialog. OK, easy enough.

Where is my entry for it?
OK, let's try the Compare entry.

Since I'm using the prod_20120122 RPD, I select the dev_20120122 RPD.
I'm prompted for the Repository Password and then it spins for a few seconds, then gives me this

I select Yes.

OK...where's the Compare Repositories Dialog like the docs say?
I see the icons have changed signifying differences, but no dialog as mentioned in the docs.
What if I select No?

Ah, there it is.
Interestingly, if I maximize that Compare Repositories Dialog, the next time I run the Compare, I can see it plain as day.

Hopefully you'll find this next time you endeavor to learn how to patch your RPD and can't seem to find the Compare Repositories Dialog.
Wednesday, September 14, 2011
OBIA: Installing Informatica 9.0.1
I'm in the process of building out a tip-to-tail dev/test system that includes the components from OBIA.
The components include:
- EBS Vision database
- Informatica PowerCenter 9.0.1
- Data Warehouse Administration Console (DAC)
- OBIEE 11.1.1.5
- OBIA 7.9.6.3
I recently rebuilt my EBS instance. I put my last go at it on a removable disk and seem to have misplaced it.
This will be part of a series of posts describing the entire process. I don't do it often enough and so I have to "remember" what I did, now I'll have my own reference.
Environment
As usual, this is running in a VirtualBox virtual machine.
- Host: Ubuntu 11.04, Natty Narwhal
- VirtualBox: 4.1.2
- Guest: Oracle Enterprise Linux (64 bit)
I grabbed the download from edelivery, file name is: V26109-01.zip.
Other references:
- OBIA 7.9.6.3 Documentation Library
- OBIA Installation Guide for Informatica PowerCenter Users Release 7.9.6.3: Specifically this section, Installing Informatica PowerCenter Services.
Step 1, create a database account.
It is simply easier, for now, to do it this way.
Step 2, unzip the files on your system.
It is recommended that you create an OS user specific to this task. I am using my previously existing oracle (dba, oinstall) account
Step 3, run the install.sh file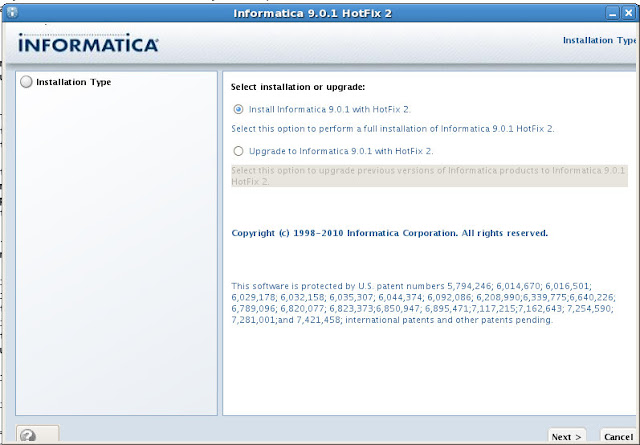
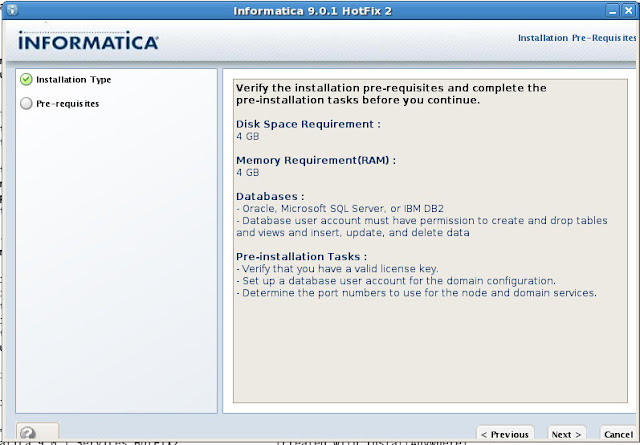
System Requirements:
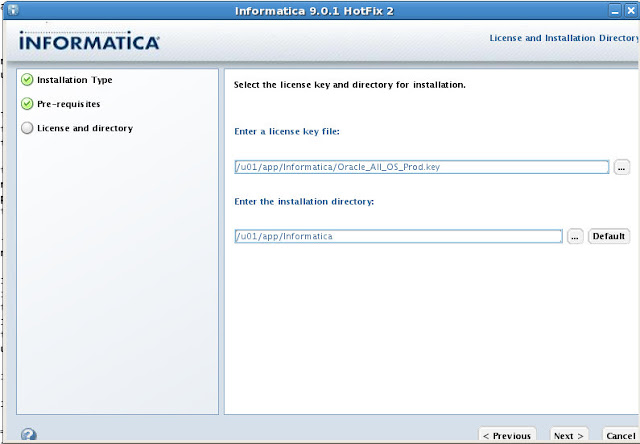
License Key and installation directory:
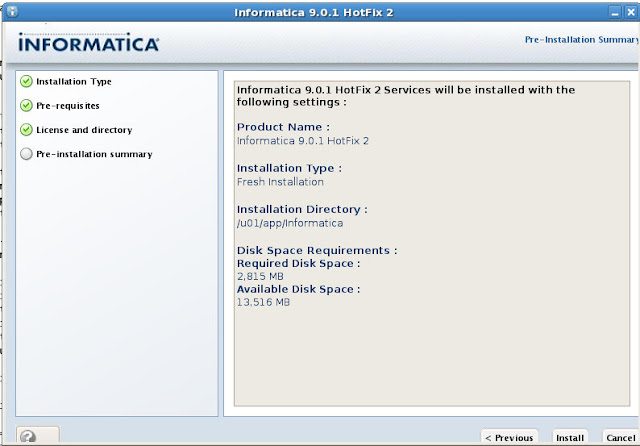
Confirmation:
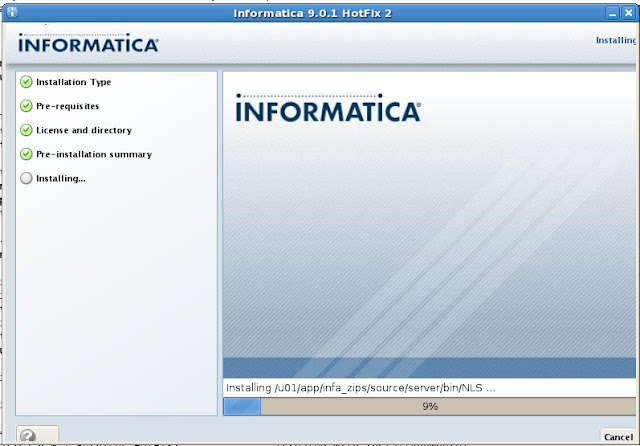
Running...
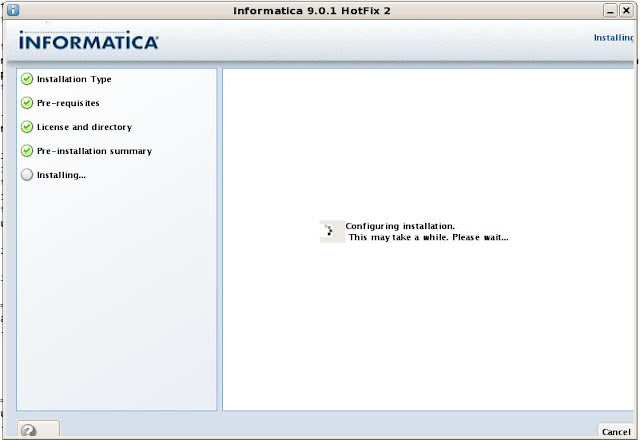
Configuring...
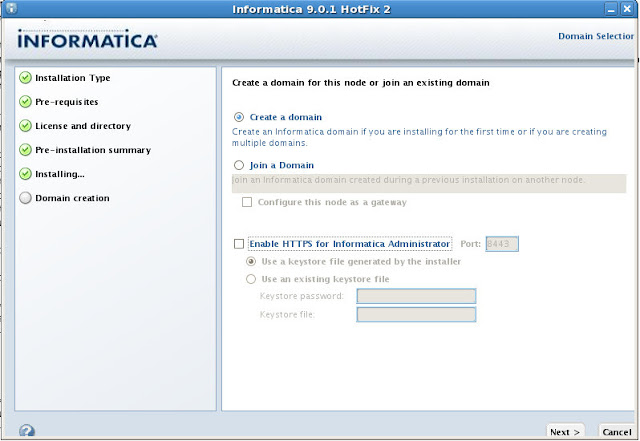
Create a domain and Enable HTTPS. Enable HTTPS is checked by default, I won't be using it.
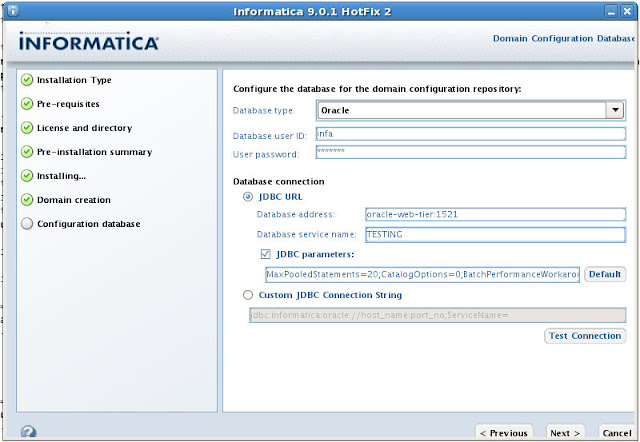
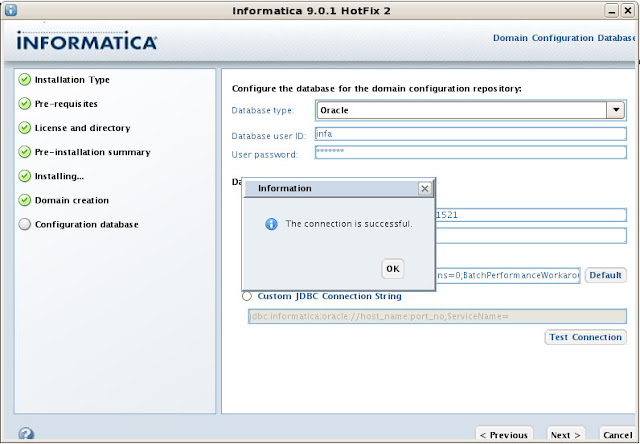
Configure the database connection and JDBC URL
Testing the connection...
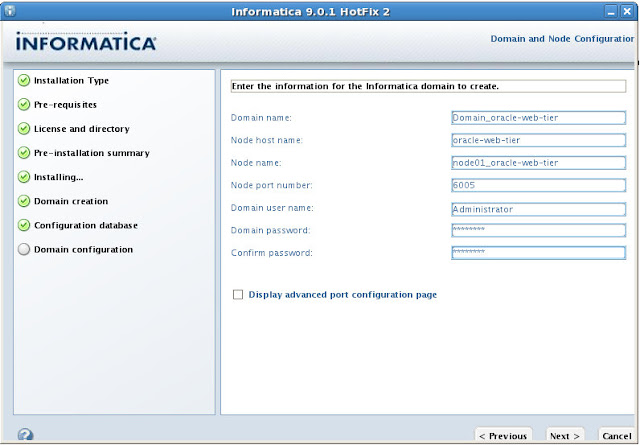
Informatica Domain. I'm going to accept the defaults:
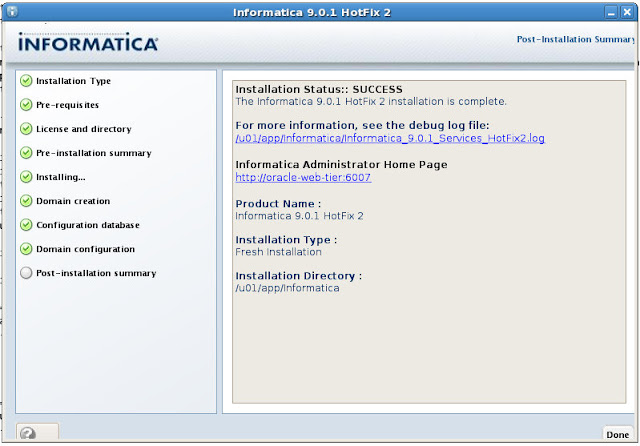
Summary
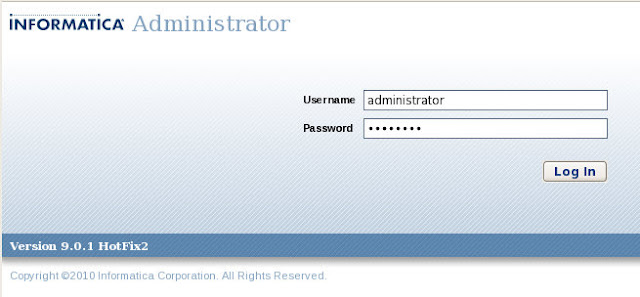
You'll be redirected to this page.

Next steps will be to cover the Information Repository Service and Informatica Integration Service. That of couse, is later.
The components include:
- EBS Vision database
- Informatica PowerCenter 9.0.1
- Data Warehouse Administration Console (DAC)
- OBIEE 11.1.1.5
- OBIA 7.9.6.3
I recently rebuilt my EBS instance. I put my last go at it on a removable disk and seem to have misplaced it.
This will be part of a series of posts describing the entire process. I don't do it often enough and so I have to "remember" what I did, now I'll have my own reference.
Environment
As usual, this is running in a VirtualBox virtual machine.
- Host: Ubuntu 11.04, Natty Narwhal
- VirtualBox: 4.1.2
- Guest: Oracle Enterprise Linux (64 bit)
Linux oracle-web-tier 2.6.32-200.13.1.el5uek #1 SMP
x86_64 x86_64 x86_64 GNU/Linux
- Installed software: 11gR2 Database, OBIEE 11.1.1.5, Oracle Web Tier
I grabbed the download from edelivery, file name is: V26109-01.zip.
Other references:
- OBIA 7.9.6.3 Documentation Library
- OBIA Installation Guide for Informatica PowerCenter Users Release 7.9.6.3: Specifically this section, Installing Informatica PowerCenter Services.
Step 1, create a database account.
CREATE USER infa IDENTIFIED BY testing
  DEFAULT TABLESPACE users;

GRANT DBA TO infa;
**Note I have given DBA privileges, this is not necessary.**
It is simply easier, for now, to do it this way.
Step 2, unzip the files on your system.
It is recommended that you create an OS user specific to this task. I am using my previously existing oracle (dba, oinstall) account
Step 3, run the install.sh file
[oracle@oracle-web-tier infa_zips]$ ./install.sh OS detected is Linux unjar task is in progress............. unjar of ESD completed..... Do you want to continue installation (y/n) ? y Starting installation ... \*************************************************************************** \* Welcome to the Informatica 9.0.1 HotFix 2 Server Installer. * \*************************************************************************** To verify whether a machine meets the system requirements for an Informatica installation, run the Pre-Installation System Check Tool (i9Pi) before you start the installation process. You can find the i9Pi tool in the following directory:/i9Pi Before you continue, read the 9.0.1 HotFix 2 Installation Guide and Release Notes. You can find the 9.0.1 HotFix 2 documentation in the Documentation Center at http://my.informatica.com Configure the LANG and LC_ALL variables to generate appropriate code pages and create and connect to repositories and Repository Services. Do you want to continue? (Y/N)Y Installer requires operating system Linux version 2.6 and later. Current operating system Linux version 2.6. Current operating system meets minimum requirements. Select a choice : 1. Install Informatica 9.0.1 with Hot Fix 2 or Upgrade from a previous version of Informatica to Informatica 9.0.1 with Hot Fix 2 2. Apply Informatica 9.0.1 Hot Fix 2 to existing 9.0.1 install. Enter the choice(1 or 2):1 ----------------------------------------------------------- Checking for existing 9.0.1 HotFix 2 product installation. Select (G)UI mode (needs X Window support) or (C)onsole mode (G/C):G Launching installer in GUI mode ... Preparing to install... Extracting the JRE from the installer archive... Unpacking the JRE... Extracting the installation resources from the installer archive... Configuring the installer for this system's environment... Launching installer... Preparing SILENT Mode Installation... =============================================================================== Informatica 9.0.1 Services HotFix2 (created with InstallAnywhere) -------------------------------------------------------------------------------

System Requirements:

License Key and installation directory:

Confirmation:

Running...

Configuring...

Create a domain and Enable HTTPS. Enable HTTPS is checked by default, I won't be using it.

Configure the database connection and JDBC URL

Testing the connection...

Informatica Domain. I'm going to accept the defaults:

Summary

===============================================================================
Configuring Installation...
---------------------------

 [==================|==================|==================|==================]
 [------------------|------------------|------------------|------------------]

Installation Complete.
To verify your installation, open up http://localhost:6007/administrator/, username is administrator and the password is the one you supplied during installation.

You'll be redirected to this page.

Next steps will be to cover the Information Repository Service and Informatica Integration Service. That of couse, is later.
Subscribe to:
Posts (Atom)
