Showing posts with label performance. Show all posts

Thursday, December 15, 2011

Trace Data: Not Just For DBAs

On Wednesday, I attended Cary Millsap's Mastering Oracle Trace Data class here in Tampa.

Why?

Why would I go? I am working with OBIEE which is about 42 layers above the database...who cares about trace data? Well, performance is usually the number 1 item on everyone's list. Page loads to slow. Report takes to long to run. Whether it's trying to tune the application server (WLS) or figure out why Report A takes so long to run, we do a lot of performance analysis. In most cases, it ends up being the SQL that is run. What I mean by the SQL is that it's usually bringing back quite a few records. I've seen people try to pull back millions of records and then pivot all that data putting a nice load on the BI Server and hogging all the resources from everyone else.

On occasion though, there are other things that are going on (with the SQL) that we can't pinpoint.

Recently we had to back out a production implementation because one of the load processes seemed to just hang, threatening to slow down a larger process.

I asked the DBAs why.

Crickets.

Shouldn't that be an answer a DBA provides?

Disk? Network? CPU? Memory? Which one?

Crickets. (I didn't ask those exact questions, I think I said, "Reads? Writes? Network? Load?")

That is just one of the reasons I wanted to attend Mr. Millsap's class. That, and I've heard he's well regarded and does a pretty decent job presenting. OK, I admit it, I just want to show the DBA up. There, said it.

I really shouldn't have to though. It's supposed to be a partnership. They don't know much about OBIEE, so I help them there. I expect help in things like this.

Why? Part II

If you are a developer, understanding trace data will make you better. You'll no longer have to guess, you'll know.

Of course there's what I hinted at above, being able to go to your DBA(s) and prove something. No better feeling in the world.

How?

MR Trace is by far the easiest. It's integrated with SQL Developer. It's a great place to start.

MR Tools - For the more advanced professional. Mostly geared towards the DBA type, but incredibly useful to developers as well. It includes:

- mrskew - your trace file profiler and data miner
- mrls: your trace file lister
- mrcallrm: your trace file correction fluid
- mrtrim: your trace file tim calculator
- mrtrimfix: your trace file time value fixer

Method R Profiler:
The classic tool that started it all, the Method R Profiler is software that makes simple work of knowing exactly why your application consumes the response time it does. With minimal training, a Method R Profiler user can—in just minutes—identify the root cause of an Oracle-based application performance problem, propose sensible solutions to it, and predict the end-user response time impact of each proposed solution.

There are of course other products, check them out here.

Ask Mr. Millsap to come to your town. Try out MR Trace. You won't be sorry you did.

Tuesday, August 30, 2011

OBIEE 11g Performance with Google Page Speed

A few weeks ago I tried out YSlow on OBIEE 11g.

I finally managed to find some time to mess around with Oracle Web Tier (HTTP and WebCache).

The results:


I went from a D to a C. Not terrible.

This time, I also used Google Page Speed.


41 out of 100 using just the application server (WLS).

Now adding in the Oracle Web Tier components, Oracle HTTP Server and Oracle Web Cache.


76 out of 100. Much better.

OBIEE 11g is built on Oracle WebLogic Server. It was not intuitive, to me anyway, that everything was being served via an application server. Therefore, there is no caching of static files or compression.

Putting a web server in front of your application server is a very easy way to increase page load times.

I would assume (stop laughing) that any web server would do the exact same thing as the Oracle Web Tier components...but, you know me.

Thursday, August 4, 2011

OBIEE 11g + YSlow

A recent discussion at the OBIEE Enterprise Methodology Group reminded me of something...

A few weeks back I tried out the YSlow extension from Yahoo against OBIEE 11g.

I couldn't figure out how to print or export the results until this morning when I clicked on the Tweet button. That gave me a URL.

For my test this morning, I used the SampleApp Build 10502 General Index (which rocks by the way, tons of great stuff and examples the team has created):


Overall Grade, D.

This page either got an A or a F. The F's were in the following categories:

- Make fewer HTTP requests
- Use a Content Delivery Network (CDN) (no idea)
- Add expires headers
- Compress components with gzip
- Put JavaScript at bottom
- Reduce the number of DOM elements
- User cookie-free domains


You can find the page here.

Interesting stuff.

Google also has an extension called PageSpeed which you can find here.

Friday, July 22, 2011

SOUG: Thinking Clearly About Performance

Alternate Title: Cary Millsap is Awesomesauce.

Last night the Suncoast Oracle Users' Group hosted Cary Millsap of Method-R Corporation. You may have heard about Mr. Millsap, he's written a few books, a few papers, done a couple of presentations...

Thinking Clearly About Performance
Find his paper here.

While the paper is good, I don't think it compares to the presentation.

This was my first second Millsap presentation I've gotten to see this year, the last was in June in Long Beach on My Case for Agile.

We were treated to 2+ hours ending a little after 9. There wasn't a dry eye in the house. Oh wait, that was something else. It was a packed house, approximately 50 attendees including Enrique Aviles (aka "evil Les" or @eaviles94) and his friend Eric, who drove down from Orlando.


One of my (many) takeaways was finally understanding what the prepare, execute and fetch were.

Here's the sequence diagram...


Here's the profile...


I had never thought of it in the context of what something like java does. Once I did, easy. Here's some pseudo-code:
ps = prepareStatement( "SELECT table_name FROM user_tables" );
rs = executeStatement( ps );
OK, not the best example, but it helped me finally make the connection.

It's All About the Skew
So you have CPU, Network, IO and Something Else. Is it divided evenly among the 4 components (talking about performance here)? 25% CPU. 25% Network. 25% IO. 25% Something Else. No, typically it's not. When you see the spike, you know that's where you start to look (is that Axiomatic?). I can't do it justice (pun intended)...so read the paper.

The beauty of this approach though is that it's not just confined to database performance, it's software performance in general. I think the "software" people get it more than we database people do too. You have to instrument your code if you are ever going to be good at Performance Tuning.

If you ever have the opportunity to see Cary speak on this topic (really, on any topic, he's incredibly good a breaking down a complex topic and making it digestable by mortals), don't hesitate, go see it.

The Future
Cary's got some plans for the near future too, so you may just get that opportunity sooner than you think. I won't spoil it, but I will announce it after he goes public.

Sunday, July 17, 2011

SOUG: Cary Millsap

We (SOUG) have the fortunate pleasure of hosting Mr. Cary Millsap.

Perhaps you've heard of him?

The topic is Thinking Clearly About Performance.

Here's the abstract:

Creating high-performance as an attribute of complex software is extremely difficult business for developers, technology administrators, architects, system analysts, and project anagers. However, by understanding some fundamental principles, performance problem solving and prevention can be made far simpler and more reliable. This paper describes those principles, linking them together in a coherent journey covering the goals, the terms, the tools, and the decisions that you need to maximize your application’s chance of having a long, productive, high-performance life. Examples in this paper touch upon Oracle experiences, but the scope of the paper is not restricted to Oracle products.

Here's Mr. Millsap's Bio (note the inclusion of the word "teacher", my favorite description):

Cary Millsap / @CaryMillsap / cary.millsap@method-r.com

Cary Millsap is a public speaker, author, teacher, software designer and developer, entrepreneur, and software technology advisor. In 2008, he founded Method R Corporation, a company dedicated to making people's application software run faster and more efficiently. Mr. Millsap's technical papers are quoted in many Oracle books, in Wikipedia, in blogs all over the world, and in dozens of conference presentations each month. His blog reaches thousands of people each month. He has presented at hundreds of public and private events around the world. He wrote the book "Optimizing Oracle Performance" (O'Reilly 2003), for which he and co-author Jeff Holt were named Oracle Magazine's 2004 Authors of the Year.

RSVP here.

Wednesday, May 4, 2011

SOUG: Cary Millsap

Performance related topics are trending this year at SOUG. By trending, I mean 2 of 7. That's a trend right?

In January, we talked Tanel Põder into taking a vacation from his vacation. Now, we get Cary Millsap of...well, fame.

If you don't know who Cary (@carymillsap) is, you should. From his blog:

Oracle performance specialist since 1989, author of "Optimizing Oracle Performance" (O'Reilly), founder and president of Method R Corporation.

Hmm...I thought he had Teacher in there. Here it is from his Google Profile:

Oracle performance specialist, author of Optimizing Oracle Performance with Jeff Holt. Founder and President of Method R Corporation. Teacher, consultant, software designer and developer.

I really like that, Teacher. Teaching.

Teachers need to understand a subject enough to convey its essence to students. While traditionally this has involved lecturing on the part of the teacher, new instructional strategies put the teacher more into the role of course designer, discussion facilitator, and coach and the student more into the role of active learner, discovering the subject of the course. In any case, the goal is to establish a sound knowledge base and skill set on which students will be able to build as they are exposed to different life experiences. Good teachers can translate information, good judgment, experience and wisdom into relevant knowledge that a student can understand, retain and pass to others. Studies from the US suggest that the quality of teachers is the single most important factor affecting student performance...

Like Tanel, I don't understand many of the finer details, I do not have that kind of experience. What makes Tanel, and Cary, stand out, is that they can make these complex topics easily consumable by mortals.

Sign up details are here.

Wednesday, April 20, 2011

Yet Another Slow Query

by Enrique Aviles

As the database performance contact I get to troubleshoot slow queries. Typically when users experience a slow application screen an incident is submitted and the issue ends up on my plate. Recently, I had to investigate a report that was taking a little over 10 minutes to generate results. Although the application is an OLTP system some screens allow users to generate a report that can be sent to the printer. Normally these reports take a few seconds to appear on the screen but this one was way over the application’s SLA requirements.

Below is a sample query construct that captures the syntax of the actual query that was executed by the application. After examining execution plans and generating extended SQL trace I identified the parts highlighted in red as the ones contributing to the query’s poor response time.
SELECT T1.COLUMN_1,
T1.COLUMN_2,
V1.COLUMN_1,
V1.COLUMN_2,
T2.COLUMN_1,
T2.COLUMN_2,
V2.COLUMN_1,
V2.COLUMN_2,
CV.USAGE,
.
.
.
24 additional columns
.
.
.
FROM
TABLE_1 T1,
TABLE_2 T2,
TABLE_3 T3,
TABLE_4 T4,
VIEW_1 V1,
VIEW_2 V2,
COMPLEX_VIEW CV
.
.
An additional mix of 7 tables and views
.
.
WHERE T1.COLUMN_4 = T2.COLUMN_5
AND T2.COLUMN_7 = T3.COLUMN8
.
.
.
AND
CV.PARAMETER_ID = T3.ID
AND CV.PART_ID = T4.ID
AND CV.LOG_DATE = (
SELECT MAX(CV2.LOG_DATE)
FROM COMPLEX_VIEW CV2
WHERE CV2.PART_ID = CV.PART_ID
AND CV2.PARAMETER_ID = CV.PARAMETER_ID
)

AND T5.ID = 'ABC123'
The query’s runtime statistics are:
Elapsed: 00:13:13.01

Statistics
----------------------------------------------------------
4013 recursive calls
6372 db block gets
65682217 consistent gets
858907 physical reads
0 redo size
3328 bytes sent via SQL*Net to client
524 bytes received via SQL*Net from client
2 SQL*Net roundtrips to/from client
3 sorts (memory)
1 sorts (disk)
1 rows processed
The query took more than 13 minutes and over 65 million consistent gets to select one row. This is obviously unacceptable so it is clear why users were not happy with that particular report. What could be causing the query to generate so much work?

The complex view is composed of twelve tables and 40 lines in the WHERE clause, five of them OR conditions. I noticed that removing the subquery that gets the maximum LOG_DATE from the complex view helped the main query to complete in just a few seconds. Obviously, results were incorrect without the subquery so I had to figure out a way to preserve the logic that gets the maximum LOG_DATE while having the query complete in a matter of seconds.

Examining the complex view data showed there were no duplicate LOG_DATEs so the MAX aggregate function will always return the absolute maximum LOG_DATE for a given PART_ID/PARAMETER_ID combination. Finding that characteristic in the data led me to consider using a scalar subquery to get the USAGE value from the complex view. In the process I also wanted to select from the complex view in one pass so I decided to use the ROW_NUMBER analytic function to get the maximum LOG_DATE and eliminate the need for a self-join via a correlated subquery. Having devised that plan, I executed the following query to test what would become the scalar subquery:
SELECT USAGE
FROM (
SELECT CV.USAGE,
ROW_NUMBER() OVER (PARTITION BY CV.PART_ID,
CV.PARAMETER_ID
ORDER BY CV.LOG_DATE DESC) RN
FROM COMPLEX_VIEW CV
WHERE CV.PARAMETER_ID = 'ABC'
AND CV.PART_ID = 'XYZ'
)
WHERE RN = 1


Elapsed: 00:00:00.02

Statistics
----------------------------------------------------------
0 recursive calls
0 db block gets
738 consistent gets
0 physical reads
0 redo size
532 bytes sent via SQL*Net to client
524 bytes received via SQL*Net from client
2 SQL*Net roundtrips to/from client
1 sorts (memory)
0 sorts (disk)
1 rows processed
Only 0.02 second and 738 consistent gets to select the USAGE value from the complex view! It looks like the plan is coming together. I proceeded to replace the correlated subquery with the scalar subquery so the main query becomes:
SELECT  T1.COLUMN_1,
T1.COLUMN_2,
V1.COLUMN_1,
V1.COLUMN_2,
T2.COLUMN_1,
T2.COLUMN_2,
V2.COLUMN_1,
V2.COLUMN_2,
(
SELECT USAGE
FROM (
SELECT CV.USAGE,
ROW_NUMBER() OVER (PARTITION BY CV.PART_ID,
CV.PARAMETER_ID
ORDER BY CV.LOG_DATE DESC) RN
FROM COMPLEX_VIEW CV
WHERE CV.PARAMETER_ID = T3.ID
AND CV.PART_ID = T4.ID
)
WHERE RN = 1
) USAGE,

.
.
.
24 additional columns
.
.
.
FROM TABLE_1 T1,
TABLE_2 T2,
TABLE_3 T3,
TABLE_4 T4,
VIEW_1 V1,
VIEW_2 V2,
.
.
An additional mix of 7 tables and views
.
.
WHERE T1.COLUMN_4 = T2.COLUMN_5
AND T2.COLUMN_7 = T3.COLUMN_8
.
.
.
AND T5.ID = 'ABC123'
Notice the complex view is not part of the FROM section and there are no joins to the complex view in the WHERE clause. I executed the new and improved query and got the following error:
ERROR at line 17:
ORA-00904: "T4"."ID": invalid identifier
The excitement was extinguished for a brief moment while I realized my mistake. How come T4.ID is an invalid identifier when I know ID is a valid column on TABLE_4? The problem is that TABLE_4 is not visible inside the inline view of the scalar subquery. The complex view is two levels deep so I can’t join CV and T4. How can I hide the logic of the scalar subquery in a way that allows me to join the complex view and TABLE_4? A view that implements the core logic of the scalar subquery achieves the desired result so I created the following view:
CREATE OR REPLACE VIEW CURRENT_USAGE
AS
SELECT USAGE,
PART_ID,
PARAMETER_ID
FROM
(
SELECT CV.USAGE,
CV.PART_ID,
CV.PARAMETER_ID,
ROW_NUMBER() OVER (PARTITION BY CV.PART_ID,
CV.PARAMETER_ID
ORDER BY CV.LOG_DATE DESC) RN
FROM COMPLEX_VIEW CV
)
WHERE RN = 1;
The main query needs to be modified again to reference the newly created view CURRENT_USAGE so it becomes:
SELECT  T1.COLUMN_1,
T1.COLUMN_2,
V1.COLUMN_1,
V1.COLUMN_2,
T2.COLUMN_1,
T2.COLUMN_2,
V2.COLUMN_1,
V2.COLUMN_2,
(
SELECT USAGE
FROM CURRENT_USAGE CU
WHERE CU.PARAMETER_ID = T3.ID
AND CU.PART_ID = T4.ID
)
USAGE,

.
.
.
24 additional columns
.
.
.
FROM TABLE_1 T1,
TABLE_2 T2,
TABLE_3 T3,
TABLE_4 T4,
VIEW_1 V1,
VIEW_2 V2,
.
.
An additional mix of 7 tables and views
.
.
WHERE T1.COLUMN_4 = T2.COLUMN_5
AND T2.COLUMN_7 = T3.COLUMN_8
.
.
.
AND T5.ID = 'ABC123'
This time around the only surprise was the following runtime statistics:
Statistics
----------------------------------------------------------
2 recursive calls
0 db block gets
28316 consistent gets
0 physical reads
0 redo size
3328 bytes sent via SQL*Net to client
524 bytes received via SQL*Net from client
2 SQL*Net roundtrips to/from client
4 sorts (memory)
0 sorts (disk)
1 rows processed
The new query returned the same data as the original query while performing a fraction of the work. Although 28,316 consistent gets is a bit high to return one row, this value is quite handsome when compared to the original value of 65 million consistent gets. This translates into a 99.96% improvement. Regarding response time, the original query took 13 minutes to complete while the new query only requires 0.3 second to generate results, also a 99.96% improvement.

Combining the right mix of database objects and SQL features helped me achieve such dramatic improvement. I hope my experience will help you consider creative solutions when faced with challenging SQL performance issues.

Wednesday, February 9, 2011

OBIEE 11g: Instrumentation

I had this great post planned out only to realize I had been beaten to the punch.

Instrumenting OBIEE for tracing Oracle DB calls

Mr. Moffatt [ LinkedIn | Twitter ] describes a way to go about finding out exactly what was being run by using DBMS_APPLICATION_INFO.

If you are working with OBIEE, any version, I would encourage you to go read his article.

What's amusing to me, is that we both tried (well, I tried, he did) to do the same after reading Cary Millsap's excellent paper, Mastering Performance with Extended SQL Trace.

I heckled Mr. Moffatt a little bit privately for stealing my thunder, but after reflection, I was thankful...I didn't have to do all that work.

Wednesday, February 2, 2011

SQL Developer + MR Trace

After last week's presentation on Advanced Oracle Troubleshooting, my interest in knowing and understanding performance related matters has been rekindled. Well, I've always been interested, I just don't know what I'm doing.

In that regard, I'm trying out some tools. Today it is MR Trace, or Mister Trace as the folks at Method-R like to call it.

They have a nice little SQL Developer plugin so I don't have to think a whole lot, which is good. I need to save those cycles for more important things.

What is MR Trace?

...is our company’s extension for the Oracle SQL Developer interactive development environment. It is a zero-click Oracle trace file collector. Every time you execute SQL or PL/SQL from your SQL Developer worksheet, MR Trace (we call it “Mister Trace”) automatically copies a carefully scoped extended SQL trace file to your SQL Developer workstation, where you can tag it for easy lookup later. The main panel lets you manipulate all the trace files you’ve collected. You can click to open a trace file with any application you choose, like the Method R Profiler or your favorite text editor.

Now, I would encourage you to watch this short video featuring Mr. Millsap.


Installation
Installation is a snap. I'll run through it real quick here.

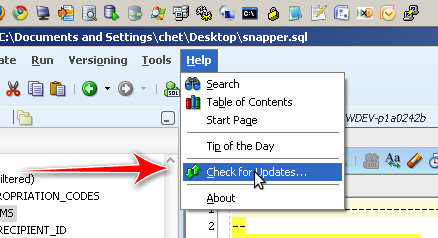
First, check for updates.


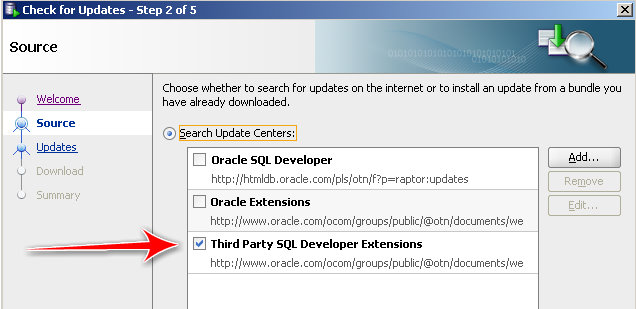
Check the Third Party SQL Developer Extensions


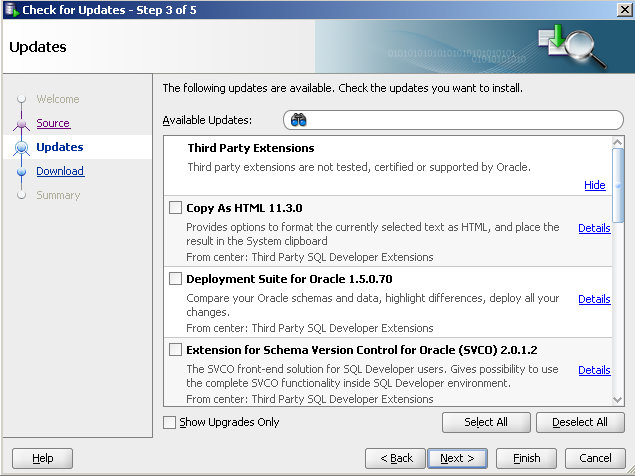
Scroll down or do a search for trace.


Running It
Dead simple appears to be their mantra, and we don't get far from that.

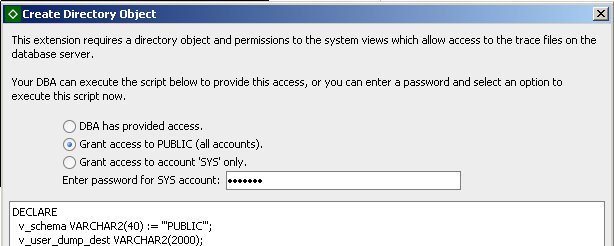
I didn't set up anything before hand, so here is what happens when you first run a SQL (or PL/SQL) statement:


You are prompted to choose how you want to do this. Since this is my sandbox, I just went for public to make things easier. Doing so requires SYS access of course.

After that you get a splash page from Method-R.

So here's what I ran:


That first row highlighted in the bottom pane, that's my trace file.

I open it up using the SQL Developer Viewer which looks like this:


A closer look...


Now, I don't have much of a clue about what all these means. That's the next step.

I like that this really is "dead simple," especially when it comes to us developers. Simple is good and usually appreciated.

What's Next?


Martin suggested checking out Trace Analyzer or TRCANLZR, which can be found here (MOS account required). Looks pretty neat, but again, I should kinda learn what the heck these things are telling me before I get too far along.

If you have a suggestion for a tool to check out, leave it in the comments. Hopefully I'll be able to get to it soon.

I would prefer something that just gives me red, yellow and green lights...:)

Thursday, January 27, 2011

SOUG: The Tanel Põder Edition

Note how I used the cool "õ" in the title. I learned that it's not really an "o" but the o with a tilde over it. It's the 24th letter of the Estonian alphabet apparently.


Note the casual attire. He was in shorts. Why? Because he was on vacation. In Miami.

Not only did he take time out from vacation to speak to us, he drove 3 or 4 hours to get here. Awesomesauce.

Naturally, it was a packed house.


(That's Dan McGhan there of APEX fame, he's bald too...but not fat)

We got the Advanced Oracle Troubleshooting in 60 minutes which turned into something closer to 2 hours. Yeah for us. I went into this meeting thinking I wouldn't get a whole lot from it. I try to read Tanel's blog but much of is just beyond me. I figured this would be more of the same.

I was pleasantly surprised to find that I got quite a bit out of it. I think the credit here goes to Tanel...he made the material incredibly easy to consume. Sure, there were moments there talking about latches and buffer cache's and stuff, but I think the message he was trying to convey was a methodology towards troubleshooting. In other words, don't use the shotgun approach. Systematic. That was the keyword. I loved the approach, I just wish I hadn't been so intimidated before now. I've wasted years of time on the shotgun approach.

I think it would be great to have a few hours (days perhaps) (probably over beer(s)) to just pick his brain. Ask questions. Get answers.

Oh...and the modesty. In one of his demos he displayed an OS stack trace (Solaris) listing all the Oracle function calls. Yeah, the "opi" prefix is for Oracle Programming Interface (I think) and this one is for that and so on and so on. You could hear the muffled laughter in the audience...the good kind...because not very many people know those things. It was fun to watch.

In other meeting news, I didn't win any prizes. I did, however, get to meet this guy:


You may recognize the picture, it was up in the top right corner of this page for a few weeks not long ago.

Guess where I met him for the first time? Twitter. Gotta love The Twitter. He and a friend drove down from Orlando just to see Tanel.

It was a great night. Next time Tanel will be staying at my house where I will provide him good beer and my wife will pepper him with questions on his travels and Estonia.

Thanks Tanel for taking time for us. Thanks Enrique for introducing yourself. Thanks SOUG for tolerating my odd behavior.

Wednesday, March 3, 2010

Learning About Performance

I've found myself at a certain disadvantage lately, specifically in regards to understanding tuning. I don't like being at a disadvantage...I'm competitive that way.

I understand, from a very high level of what needs to be done, but I could not prove my theories. Well, I could, sort of, but it wasn't necessarily a reasoned or logical approach. I just tried all possible permutations. There's a certain time constraint with that method and when you're talking about huge volumes of data (i.e. datawarehouses), time is short.

I've decided it's time to change that, so I'll begin to peck away ever so slowly.

In Usage Tracking, there is a table called S_ETL_TIME_DAY. It's a sister table to S_ETL_DAY which is your everyday time dimension. S_ETL_TIME_DAY breaks down a single day into hours and minutes which means there are 1440 records (24*60*60).

Somewhere I saw the following SQL:
SELECT DISTINCT hours
FROM s_etl_time_day
which just returns the hours in the day (24). I've pondered on whether DISTINCT is a bug, but it seems fairly innocuous here.

What about this though?
SELECT rownum - 1 hours
FROM dual
CONNECT BY LEVEL <= 24;
Which one is faster?

Let's try an explain plan

Query 1
S_NQ_SCHED@TESTING>EXPLAIN PLAN FOR
2 SELECT rownum - 1 hours
3 FROM dual
4 CONNECT BY LEVEL <= 24;

Explained.

Elapsed: 00:00:00.05
S_NQ_SCHED@TESTING>@EXPLAIN

PLAN_TABLE_OUTPUT
------------------------------------------------------------------------------
Plan hash value: 1731520519

------------------------------------------------------------------------------
| Id | Operation | Name | Rows | Cost (%CPU)| Time |
------------------------------------------------------------------------------
| 0 | SELECT STATEMENT | | 1 | 2 (0)| 00:00:01 |
| 1 | COUNT | | | | |
|* 2 | CONNECT BY WITHOUT FILTERING| | | | |
| 3 | FAST DUAL | | 1 | 2 (0)| 00:00:01 |
------------------------------------------------------------------------------

Predicate Information (identified by operation id):
---------------------------------------------------

2 - filter(LEVEL<=24)

15 rows selected.
Query 2
S_NQ_SCHED@TESTING>EXPLAIN PLAN FOR
2 SELECT DISTINCT hours
3 FROM s_etl_time_day;

Explained.

Elapsed: 00:00:00.04
S_NQ_SCHED@TESTING>@explain

PLAN_TABLE_OUTPUT
--------------------------------------------------------------------------------------
Plan hash value: 878743397

-------------------------------------------------------------------------------------
| Id | Operation | Name | Rows | Bytes | Cost (%CPU)| Time |
-------------------------------------------------------------------------------------
| 0 | SELECT STATEMENT | | 24 | 72 | 5 (20)| 00:00:01 |
| 1 | HASH UNIQUE | | 24 | 72 | 5 (20)| 00:00:01 |
| 2 | TABLE ACCESS FULL| S_ETL_TIME_DAY | 1440 | 4320 | 4 (0)| 00:00:01 |
-------------------------------------------------------------------------------------

9 rows selected.
Sadly, about the only thing I can usually see in an explain plan is whether an index is being picked up or if there is a nested loop. I'm not going to worry about all of it now...this is just a start. More to get me in the habit.

Next I set up tracing since "reading" the file is so much easier now.
ALTER SESSION SET TRACEFILE_IDENTIFIER = 'HOURS';

ALTER SESSION SET EVENTS '10046 TRACE NAME CONTEXT FOREVER, LEVEL 12';
Here's the output:
Query 1Query 2
What does it all mean? I am sure you know or understand better than I. For me, I just need to create the habit. I'll read (more) about the specifics of the explain plan and the output from tkprof. If you want to explain, feel free. If you want to do it in your own post, link it up or you can write it here. I'd be happy to host it.

Wednesday, February 17, 2010

OBIEE: Usage Tracking Performance Improvements

Usage Tracking, in OBIEE, allows you to capture some basic statistics on your Presentation layer.

I mused recently about diving into the "internals" of OBIEE, specifically learning how to read the logs (Execution Plans) and other stuff.

Mr. Mark Rittman was kind enough to share his thoughts on the matter in the comment section. I'm reposting here because I believe it is valuable insight.
Regarding the thoughts on OBIEE performance. Here's my thinking on the subject.

When I found out about concepts such as OBIEE "driving tables", level 5 logging and BI Server execution plans, my first reaction was to try and dissect them, try and understand them in the same way that I understand the various types of Oracle joins (hash/nested loop etc), Oracle trace files, 10035 traces etc. At the end of the day the BI Server is a virtual database engine and it makes sense to understand and tune it in the same way that we do with Oracle.

But then, the reality is, if you are spending time understanding level 5 log files, the various federated query optimization techniques, to be honest you'd be better off trying to optimize the underlying data so that the BI Server didn't then have to use these features.

For example - if you're trying to optimize a federated query, you should try and co-locate the data instead, either by copying both data sets to the same physical database, or better still, combine them into a data mart or warehouse. If you are having problems with aggregation and start thinking about the Aggregate Persistence Wizard - well you'd be better off putting the data into Essbase instead, and run OBIEE against that rather than your detail-level database.

And so on. So whilst it's interesting to see how the internals of the BI Server work, how it joins data, how you can optimize cross-database joins etc, in the end this is more from the intellectual angle, as you get far more "bang for your buck" by sorting out the data layer away from OBIEE and then bring a more optimized set of data into the BI Server. "Less is more" is my perspective with OBIEE, and the more that we can do at the (Oracle) database or (Essbase) OLAP server end, and keep the BI Server model simple, is the better in my book.

Just my 0.02
That last paragraph is key. Push the data into the database and keep the OBIEE model simple. Sounds right up my alley!

With Mr. Rittman's comments swirling in my head, I went about my performance tuning a bit differently.

We added some user tables to the Usage Tracking model, which seem to bring the performance to a screeching halt. A halt is defined at about a minute or so for the complete page to render...well, the page renders, I guess I mean the queries to return.

Here's essentially what it looks like:

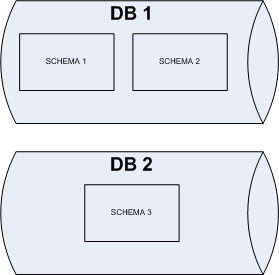
Usage Tracking Setup

Two databases and three separate schemas.

The very first thing I did was limit the number of rows returned to the BI Server from S_NQ_ACCT. Looking at the data more closely, it was pulling in more than just the reports, it had stats for ValuePrompts and Filters as well. Those weren't needed. I created a view on top of S_NQ_ACCT which returned about a quarter of the records. For perspective, I'm dealing with about 400K records.

Added that to the Physical Layer (File --> Import --> From Database) then updated the sources.

Ran the offending page...no difference.

Looking at the logs, I can see 4 queries being sent to the 2 databases. It appears that OBIEE won't push the join to the database if using separate connection pools. After thinking about it, it made perfect sense, OBIEE can't assume that each connection has the same privileges as the other. (Though I cannot confirm that yet, just seems logical).

Next, I pulled the data from Schema 2 into Schema 1.

Ran the page, no difference.

Checked the logs, and there were still 4 queries sent to the 2 databases. To be fair, I may have run the page prior to the changes being propogated to the BI Server.

OK...let's pull the data from DB 2 and see what happens. Import the table, configure everything.

Ran the page, no difference.

Looking at the logs this time, I saw 3 queries. Better right?

For fun, I decided to put the results of Query 2 and Query 3 into a table. Configured everything...blah blah blah.

Ran the page, it can up almost immediately. I called 2 people and had them run the same report and they saw the same behavior. Win! (Caching is not turned on in this environment).

When I looked at the log, a single query was sent to the database. It was an ugly query, but the joins took place in the database as opposed to the BI Server.

This won't be the final implementation, I'll probably have to back out these changes. But it's a great proof of concept.

Tuesday, November 24, 2009

Playing With PARALLEL

I'm trying to learn about PARALLEL and how it affects SELECT statements in a DW/DSS (non OLTP) environment. I can't really say I know what I'm doing or what I'm looking at, but I'm trying.

I had a DBA strongly discourage me from using PARALLELism on reporting tables (i.e. facts or dimensions). I think he even tried to explain it to me...but it was even more over my head at that time. I think it had something to do with all the processes kicked off then multiplied by the number of users running queries on those tables. "It will bring the database to its knees" he use to say. I never fought much on that because 1, he explained it to me 2, I trusted him and 3, he showed me once all the processes spawned during a typical data load operation. (I thought that was really cool by the way, all those neat little processes doing little chunks of work).

He did however let me (us) use them on staging tables. This is typically where our transformations took place. INSERTs and/or partition swapping.

Anyway, I was reading the 10gR2 docs, the Data Warehousing Guide to be exact on Using Parallel Execution. Lots of neat pictures...which is good for me.


Then I decided to see if I could see what the run times on a SELECT COUNT(*) would be given different levels of parallelism. If you want to know if a table or index has PARALLEL enabled, you need to look at the DEGREE column in %_TABLES and %_INDEXES. I spent about 20 minutes looking for PARALLEL in those tables before I remembered that.
CREATE TABLE big_table 
AS
SELECT *
FROM dba_objects;
I know have 74,431 records to play with. It's not a lot, I know, I just want to see what happens. I then created an anonymous block to:
1. loop through and change the PARALLELism starting with 1 up to 8
2. get the start time from DBMS_UTILITY.GET_TIME
3. loop doing 20 SELECT COUNT(*)s on table table
4. get the end time
5. get the total time
6. print it out
7. put it in a spreadsheet to compare the results side by side
DECLARE
l_start NUMBER;
l_end NUMBER;
l_total NUMBER;
l_dummy INTEGER;
BEGIN
FOR j IN 1..8 LOOP
EXECUTE IMMEDIATE 'ALTER TABLE big_table PARALLEL ' || j;
dbms_output.put_line( 'PARALLEL (DEGREE): ' || j );
FOR i IN 1..20 LOOP
l_start := dbms_utility.get_time;

SELECT COUNT(*)
INTO l_dummy
FROM big_table;

l_end := dbms_utility.get_time;

l_total := l_end - l_start;

dbms_output.put_line( 'Run ' || LPAD( i, 2, '0' ) || ': ' || LPAD( l_total, 3, '0' ) );
END LOOP;
END LOOP;
END;
/
And here are my results:


Sorry that it's an image...I can't seem to get decently formatted text into Blogger lately.

For this silly, unscientific test, PARALLEL set to 1 (i.e. NOPARALLEL) was the fastest all the way down. I don't know what it means or if it's even valid, but hey, I'm trying. I figured that if I posted something way above my head all you nice folks out there would happily correct me if I mistated something. I am avoiding any statements, if you couldn't tell.