In that regard, I'm trying out some tools. Today it is MR Trace, or Mister Trace as the folks at Method-R like to call it.
They have a nice little SQL Developer plugin so I don't have to think a whole lot, which is good. I need to save those cycles for more important things.
What is MR Trace?
...is our company’s extension for the Oracle SQL Developer interactive development environment. It is a zero-click Oracle trace file collector. Every time you execute SQL or PL/SQL from your SQL Developer worksheet, MR Trace (we call it “Mister Trace”) automatically copies a carefully scoped extended SQL trace file to your SQL Developer workstation, where you can tag it for easy lookup later. The main panel lets you manipulate all the trace files you’ve collected. You can click to open a trace file with any application you choose, like the Method R Profiler or your favorite text editor.
Now, I would encourage you to watch this short video featuring Mr. Millsap.
Installation
Installation is a snap. I'll run through it real quick here.
First, check for updates.
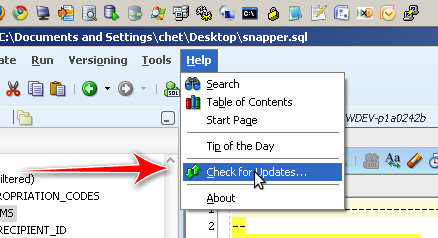
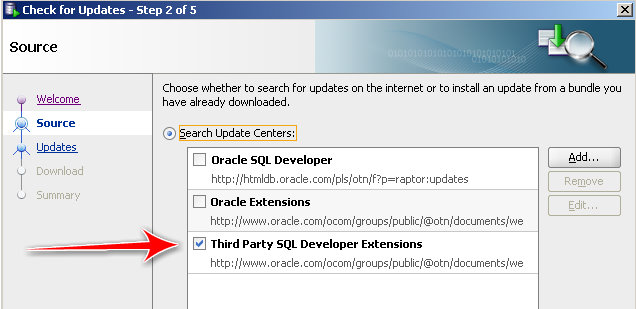
Check the Third Party SQL Developer Extensions
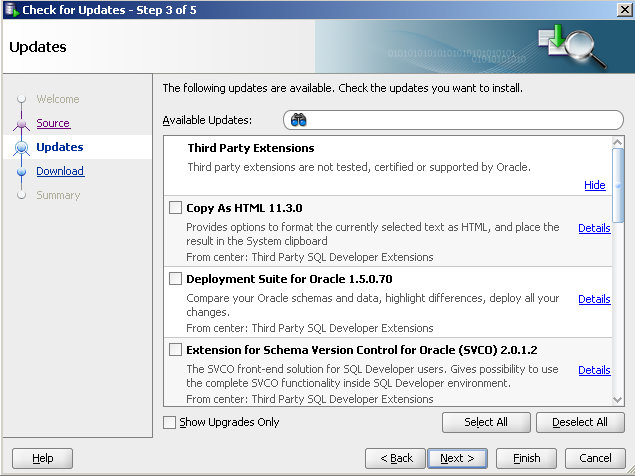
Scroll down or do a search for trace.
Running It
Dead simple appears to be their mantra, and we don't get far from that.
I didn't set up anything before hand, so here is what happens when you first run a SQL (or PL/SQL) statement:
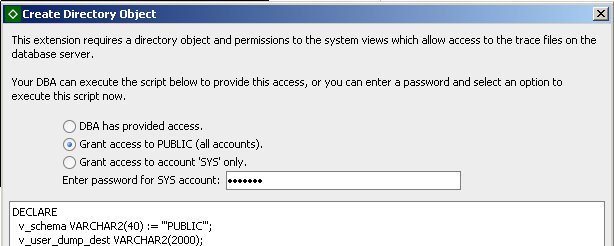
You are prompted to choose how you want to do this. Since this is my sandbox, I just went for public to make things easier. Doing so requires SYS access of course.
After that you get a splash page from Method-R.
So here's what I ran:

That first row highlighted in the bottom pane, that's my trace file.
I open it up using the SQL Developer Viewer which looks like this:

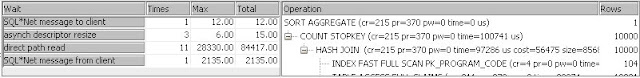
A closer look...
Now, I don't have much of a clue about what all these means. That's the next step.
I like that this really is "dead simple," especially when it comes to us developers. Simple is good and usually appreciated.
What's Next?

Martin suggested checking out Trace Analyzer or TRCANLZR, which can be found here (MOS account required). Looks pretty neat, but again, I should kinda learn what the heck these things are telling me before I get too far along.
If you have a suggestion for a tool to check out, leave it in the comments. Hopefully I'll be able to get to it soon.
I would prefer something that just gives me red, yellow and green lights...:)
2 comments:
I do not know any tool which gives you red/yellow/green in a useful way.
I'd suggest you take one particular trace file and try it out with as much tools as you can.
I prefer TVD$XTAT - if it's not needed to be integrated:
http://antognini.ch/2008/10/introduce-tvdxtat/
or you can try Alberto Dell'Eras xtrace:
http://www.adellera.it/xtrace/index.html
Then choose the one which fits your needs best.
Thank you so much for this.
If you want "Here is your response time, all of it" in color, with drill-down detail, that's where our Method R Profiler comes in. If you want text-based answers to just about any question you can think of, that's MR Tools.
Yesterday, I did this:
- I used an exprimental tool called mrtimfix that fixes trace file time values messed up by bug 7522002. So far, the experiment is going well.
- With mrskew, I found out where all my 'SQL*Net message from client' calls with response times greater than 1.0 second are, so I could examine whether these are end-user think time, or actual system processing time (e.g., on a Java tier).
- Then I "removed" those calls using a pre-beta tool called mrcallrm, which compresses the calls I didn't want, adjusting the time values throughout the file appropriately. Now I can do some real work.
- I used the Profiler to show me a color rendition of where all the time had gone in two similar sessions executed on two different systems. The Profiler showed the recursive relationships among SQL statements and exactly how much time each consumed, both inclusive of and exclusive of its recursive progeny.
- I compared subroutine call response times across files by grouping mrskew response time output by a concatenation of file name and (db|sys)call name. This showed me the high-level difference between the response times in the two files.
- I grouped response times in mrskew by file name and SQL hash value to do a direct side-by-side comparison of response time by SQL statement.
- I drilled into each SQL statement that I wanted to analyze with mrskew by using the hash value in my --where expression and subroutine call name in the --group expression.
- I saw the complete progression of every database call and syscall executed for each SQL statement by using the hash value in the --where expression and the line number concatenated to the call name in the --group expression, and I used the --sort expression to sort numerically, which gave me control flow of a statement's processing with response time reporting.
- I could have (but didn't need to) checked out the skew in read call durations by using mrskew's --name='db.*read' and then drilled down by grouping by file id (and block id if I wanted, to see if there are any hot devices) and looked at response time by call size by grouping by the #blocks value.
- I looked at only the statements at recursive depth 1 (because there was a weird problem identified in the Method R Profiler output of there being way too much recursive SQL) by using mrskew --group='$hv' --where='$dep==1'. I drilled down from there, using appropriate --where='$hv eq "x"' values.
That's the tip of the iceberg.
Post a Comment