I mused recently about diving into the "internals" of OBIEE, specifically learning how to read the logs (Execution Plans) and other stuff.
Mr. Mark Rittman was kind enough to share his thoughts on the matter in the comment section. I'm reposting here because I believe it is valuable insight.
Regarding the thoughts on OBIEE performance. Here's my thinking on the subject.That last paragraph is key. Push the data into the database and keep the OBIEE model simple. Sounds right up my alley!
When I found out about concepts such as OBIEE "driving tables", level 5 logging and BI Server execution plans, my first reaction was to try and dissect them, try and understand them in the same way that I understand the various types of Oracle joins (hash/nested loop etc), Oracle trace files, 10035 traces etc. At the end of the day the BI Server is a virtual database engine and it makes sense to understand and tune it in the same way that we do with Oracle.
But then, the reality is, if you are spending time understanding level 5 log files, the various federated query optimization techniques, to be honest you'd be better off trying to optimize the underlying data so that the BI Server didn't then have to use these features.
For example - if you're trying to optimize a federated query, you should try and co-locate the data instead, either by copying both data sets to the same physical database, or better still, combine them into a data mart or warehouse. If you are having problems with aggregation and start thinking about the Aggregate Persistence Wizard - well you'd be better off putting the data into Essbase instead, and run OBIEE against that rather than your detail-level database.
And so on. So whilst it's interesting to see how the internals of the BI Server work, how it joins data, how you can optimize cross-database joins etc, in the end this is more from the intellectual angle, as you get far more "bang for your buck" by sorting out the data layer away from OBIEE and then bring a more optimized set of data into the BI Server. "Less is more" is my perspective with OBIEE, and the more that we can do at the (Oracle) database or (Essbase) OLAP server end, and keep the BI Server model simple, is the better in my book.
Just my 0.02
With Mr. Rittman's comments swirling in my head, I went about my performance tuning a bit differently.
We added some user tables to the Usage Tracking model, which seem to bring the performance to a screeching halt. A halt is defined at about a minute or so for the complete page to render...well, the page renders, I guess I mean the queries to return.
Here's essentially what it looks like:
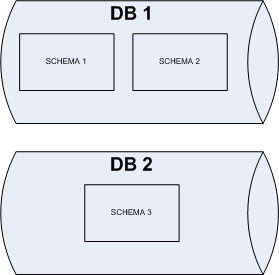
Two databases and three separate schemas.
The very first thing I did was limit the number of rows returned to the BI Server from S_NQ_ACCT. Looking at the data more closely, it was pulling in more than just the reports, it had stats for ValuePrompts and Filters as well. Those weren't needed. I created a view on top of S_NQ_ACCT which returned about a quarter of the records. For perspective, I'm dealing with about 400K records.
Added that to the Physical Layer (File --> Import --> From Database) then updated the sources.
Ran the offending page...no difference.
Looking at the logs, I can see 4 queries being sent to the 2 databases. It appears that OBIEE won't push the join to the database if using separate connection pools. After thinking about it, it made perfect sense, OBIEE can't assume that each connection has the same privileges as the other. (Though I cannot confirm that yet, just seems logical).
Next, I pulled the data from Schema 2 into Schema 1.
Ran the page, no difference.
Checked the logs, and there were still 4 queries sent to the 2 databases. To be fair, I may have run the page prior to the changes being propogated to the BI Server.
OK...let's pull the data from DB 2 and see what happens. Import the table, configure everything.
Ran the page, no difference.
Looking at the logs this time, I saw 3 queries. Better right?
For fun, I decided to put the results of Query 2 and Query 3 into a table. Configured everything...blah blah blah.
Ran the page, it can up almost immediately. I called 2 people and had them run the same report and they saw the same behavior. Win! (Caching is not turned on in this environment).
When I looked at the log, a single query was sent to the database. It was an ugly query, but the joins took place in the database as opposed to the BI Server.
This won't be the final implementation, I'll probably have to back out these changes. But it's a great proof of concept.
No comments:
Post a Comment